From Tabular Data to Embeddings: Reimagining Feature Engineering
As data scientists, we’ve all been there: hours spent crafting features, normalizing values, encoding categories, and handling outliers. For decades, feature engineering has been both art and science — a necessary ritual before feeding data to machine learning algorithms.
But what if there was another way?
What if we could eliminate traditional feature engineering entirely, instead converting raw tabular data into meaningful text, and then into vector embeddings that capture the semantic relationships between data points?
That’s exactly what the tab2vec project aims to explore.
The Big Idea
The concept is deceptively simple:
- Convert tabular data (both numeric and categorical) into human-readable text descriptions
- Transform these descriptions into vector embeddings using language models
- Train machine learning models using these embeddings instead of raw features
This approach offers several potential advantages:
- Reduce feature engineering time by automating the conversion process
- Capture semantic relationships in data that traditional encoding misses
- Apply transfer learning from large language models to tabular data
- Standardize preprocessing across different types of datasets
- Native integration with vector databases, making it possible to retrieve tabular data by semantic similarity rather than filters or LLM-to-SQL engines
The Problem with Traditional Approaches
When working with tabular data, we typically treat each feature as independent. We normalize numeric features, one-hot encode categorical ones, and possibly create interactions between them. But this approach fails to capture the rich semantic relationships that might exist in the data.
Consider housing price prediction: The relationship between “neighborhood” and “quality rating” isn’t just two independent features — there’s context there that traditional encoding fails to capture.
The tab2vec Framework
To properly test this idea, I built tab2vec, a framework for benchmarking different approaches to encoding tabular data as text for embeddings. The framework follows a modular architecture:
┌─────────────┐    ┌─────────────┐    ┌─────────────┐    ┌─────────────┐
│ Tabular     │    │ Text        │    │ Vector      │    │ ML          │
│ Data        │───▶│ Encoder     │───▶│ Embedder    │───▶│ Model       │
└─────────────┘    └─────────────┘    └─────────────┘    └─────────────┘
Each component is pluggable, allowing experimentation with different text encoding strategies, embedding models, machine learning algorithms, and datasets.
Initial Experiments with Synthetic Data
Before tackling real-world datasets, I ran benchmarks on several synthetic datasets to establish baselines and validate the approach.
Synthetic Dataset Generation
I created multiple types of synthetic datasets:
- Abstract datasets with purely numerical features (no inherent meaning)
- Semantic datasets simulating domains like:
- Customer financial data (income, credit score, debt ratio)
- Health metrics (blood pressure, cholesterol, BMI)
- Real estate properties (size, bedrooms, neighborhood quality)
Baseline vs. Embedding Performance
| Dataset Type | Task | Direct Features | Text Embeddings |
|---|---|---|---|
| Abstract | Classification | 89% accuracy | 50.5% accuracy |
| Abstract | Regression | R² = 0.956 | R² = 0.492 |
| Semantic Health | Classification | 97% accuracy | 90% accuracy |
| Semantic Health | Regression | R² = 0.998 | R² = 0.903 |
| Semantic Customer | Classification | 98.5% accuracy | 76% accuracy |
| Semantic Customer | Regression | R² = 0.904 | R² = 0.785 |
| Semantic Real Estate | Regression | R² = 0.964 | R² = 0.762 |
| Ames Housing | Regression | R² = 0.973 | R² = 0.716 → 0.840* |
* After template optimization, discussed below
The pattern was clear: text embeddings struggled with abstract numerical data but performed reasonably well on semantically meaningful domains. The gap was most significant for abstract data (38.5 percentage points in classification), but narrowed considerably for semantic domains (7 percentage points in health classification).
The Importance of Semantic Context
Consider this abstract encoding:
Sample with age: 0.4249783431863819, income: 1.8881671003483596,
education level: -1.6293918257219868, credit score: 0.4655578248059355,
account balance: -2.0121677332442007...
The standardized values carry no semantic meaning an embedding model can leverage. By contrast:
Patient is a 42-year-old with normal blood pressure (118/75),
slightly elevated cholesterol (210), and a BMI of 26.4 (overweight).
This provides rich context that embedding models understand from pre-training.
Key Learnings from Synthetic Data
- Raw numerical values perform poorly: standardized numbers without context are essentially meaningless to embedding models
- Domain-specific terminology matters: medical terms, financial concepts, and real estate jargon are better captured
- Feature naming improves results: named features (
age: 42) outperform generic ones (feature_1: 42) - Human-readable formatting helps: natural language descriptions outperform comma-separated lists
- Semantic relationships transfer: pre-existing knowledge in embedding models (e.g., that higher cholesterol is worse) transfers to predictions
The Ames Housing Dataset Experiment
The Baseline
Using CatBoost directly on the features: R² of 0.97. A high bar.
First Attempt: Basic Text Encoding
Property: {property_type} with {bedrooms} bedrooms, {bathrooms} bathrooms,
{area} sq ft, {age} years old. Quality rating: {quality}/10.
Features: {has_garage} garage, {has_pool} pool.
Neighborhood: {neighborhood}. Price per sq ft: ${price_per_sqft}.
Using nomic-embed-text + CatBoost: R² of 0.71 — respectable, but far below the baseline.
The Template Optimization Journey
Could the way we represent data as text impact model performance? That question led to three phases of experimentation.
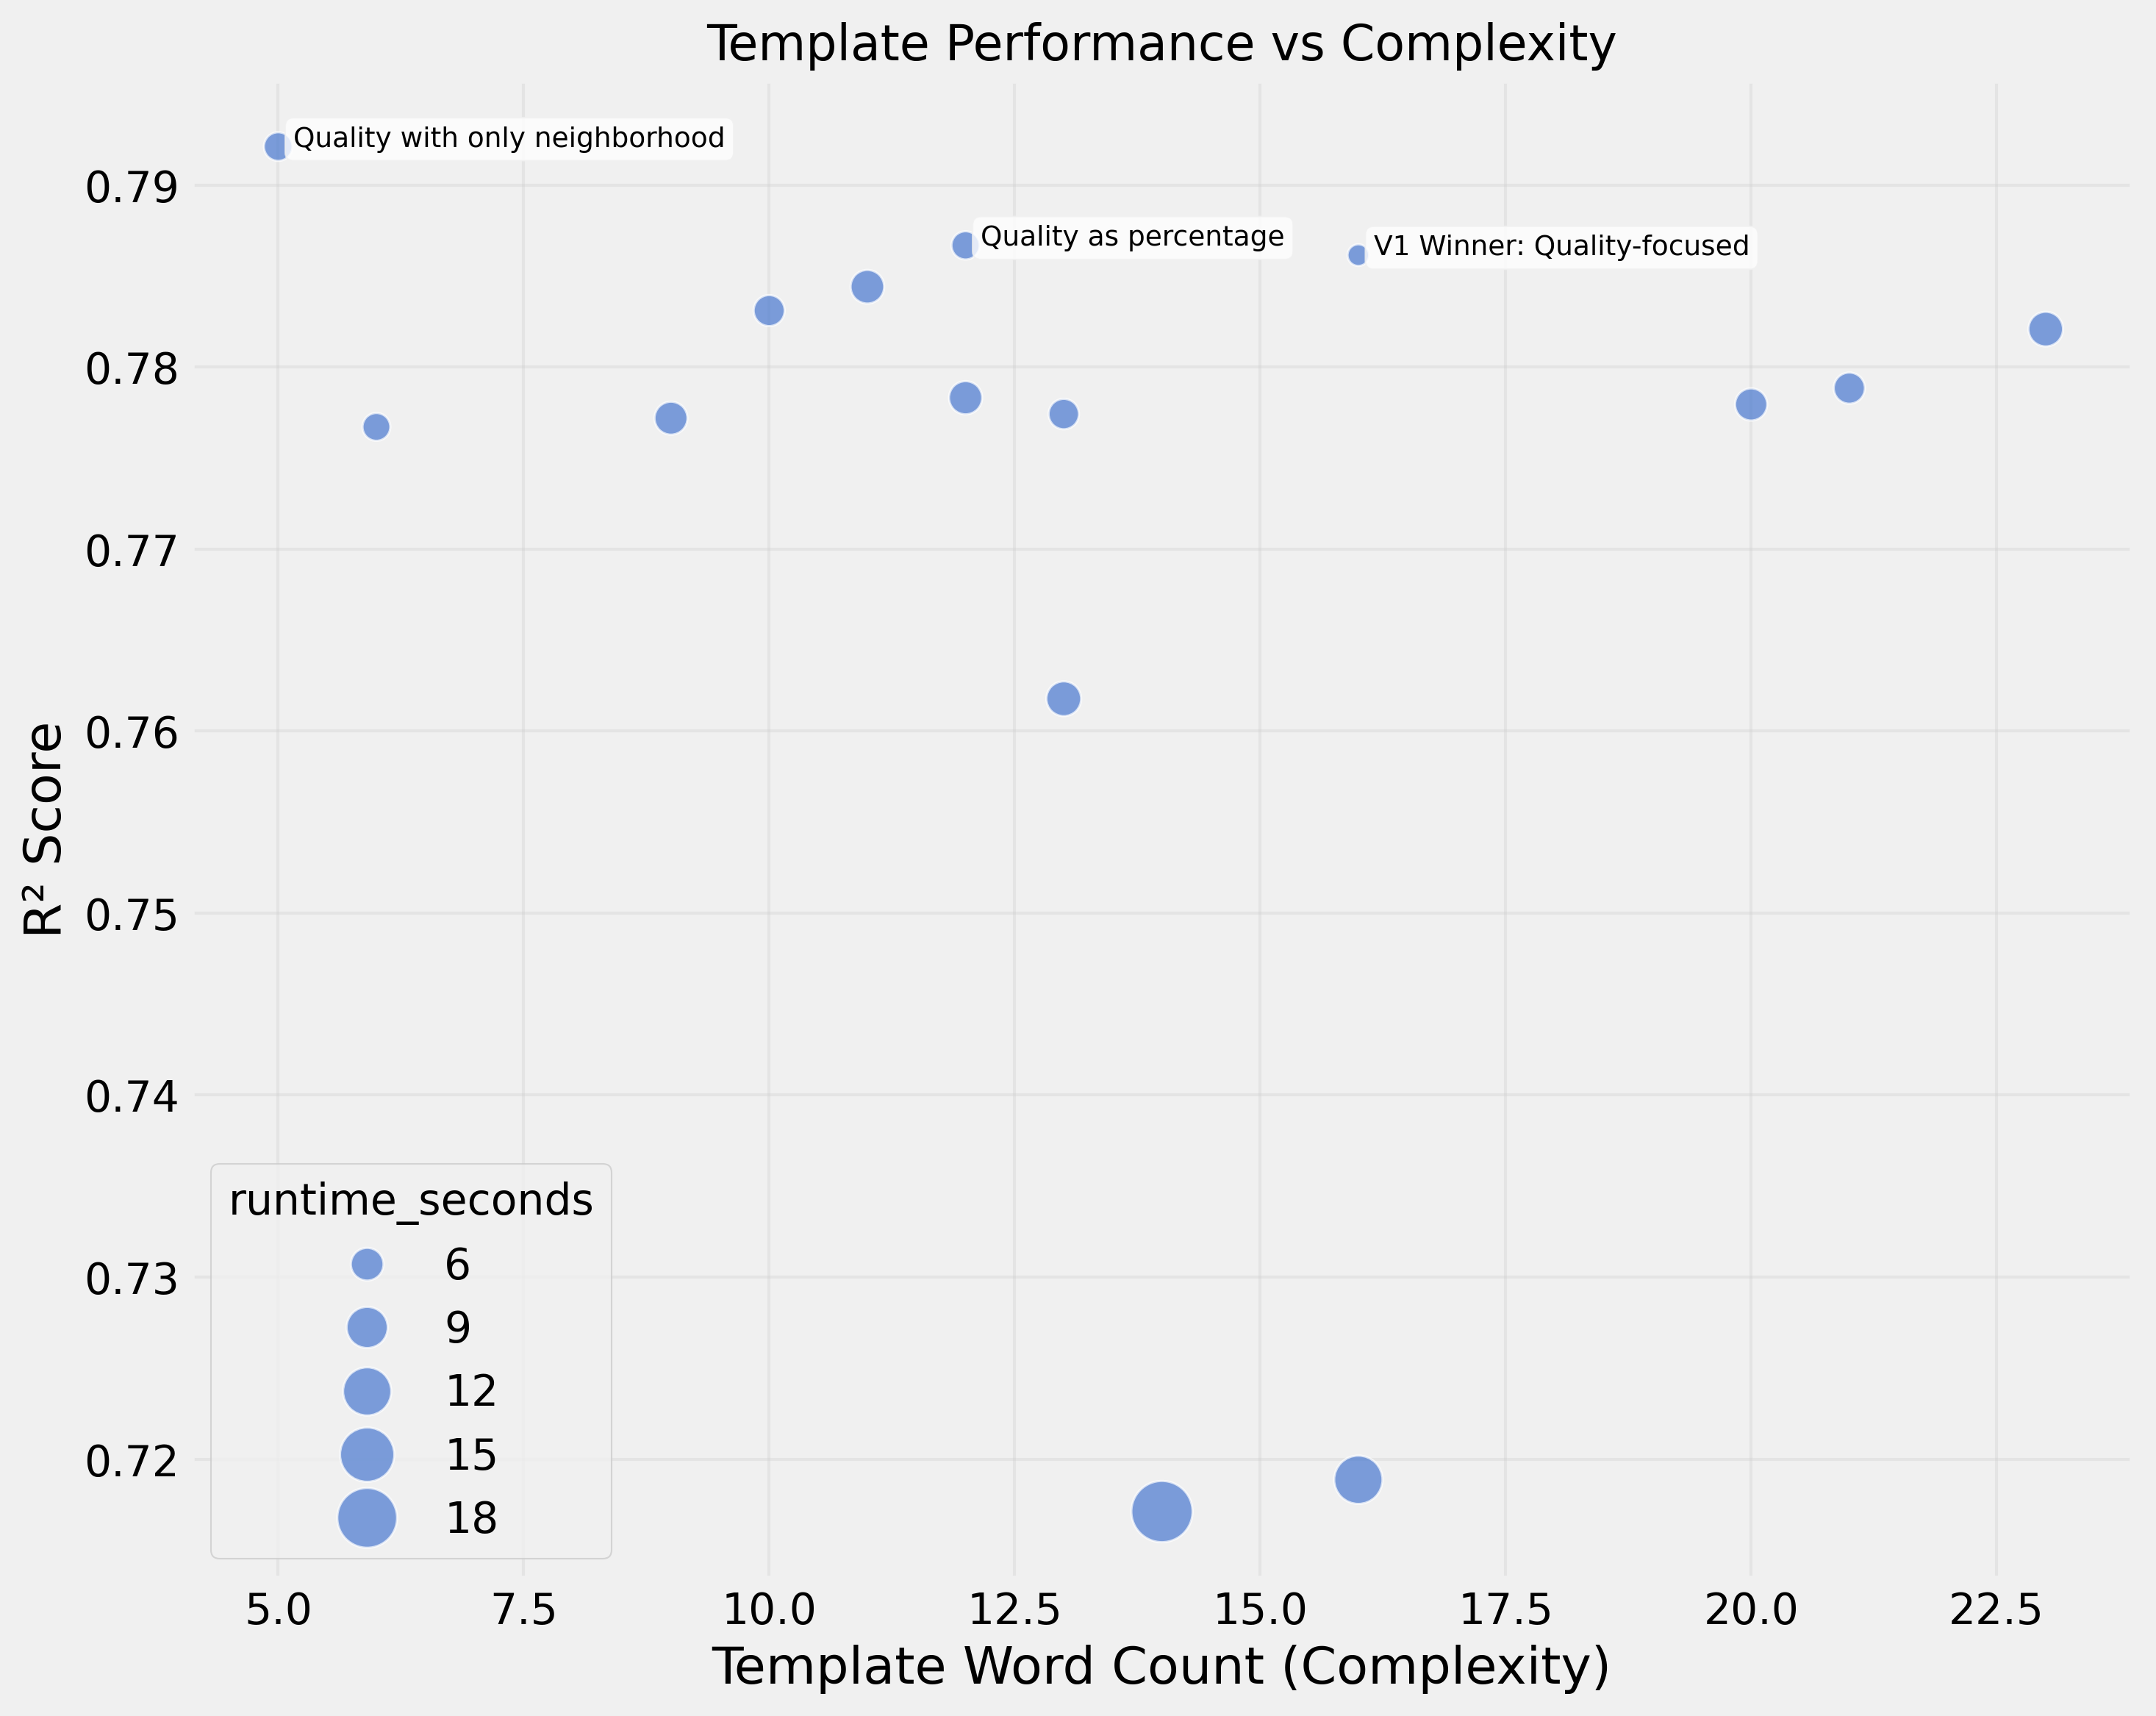
Phase 1: Template Design Matters
Testing 21 different templates revealed that design significantly impacts performance. The best template achieved R² of 0.79.
The winner focused on quality ratings and categorical features while omitting size and room details:
Quality rating: {quality}/10. Features include: Garage ({has_garage}),
Swimming pool ({has_pool}). Property type: {property_type},
located in {neighborhood}.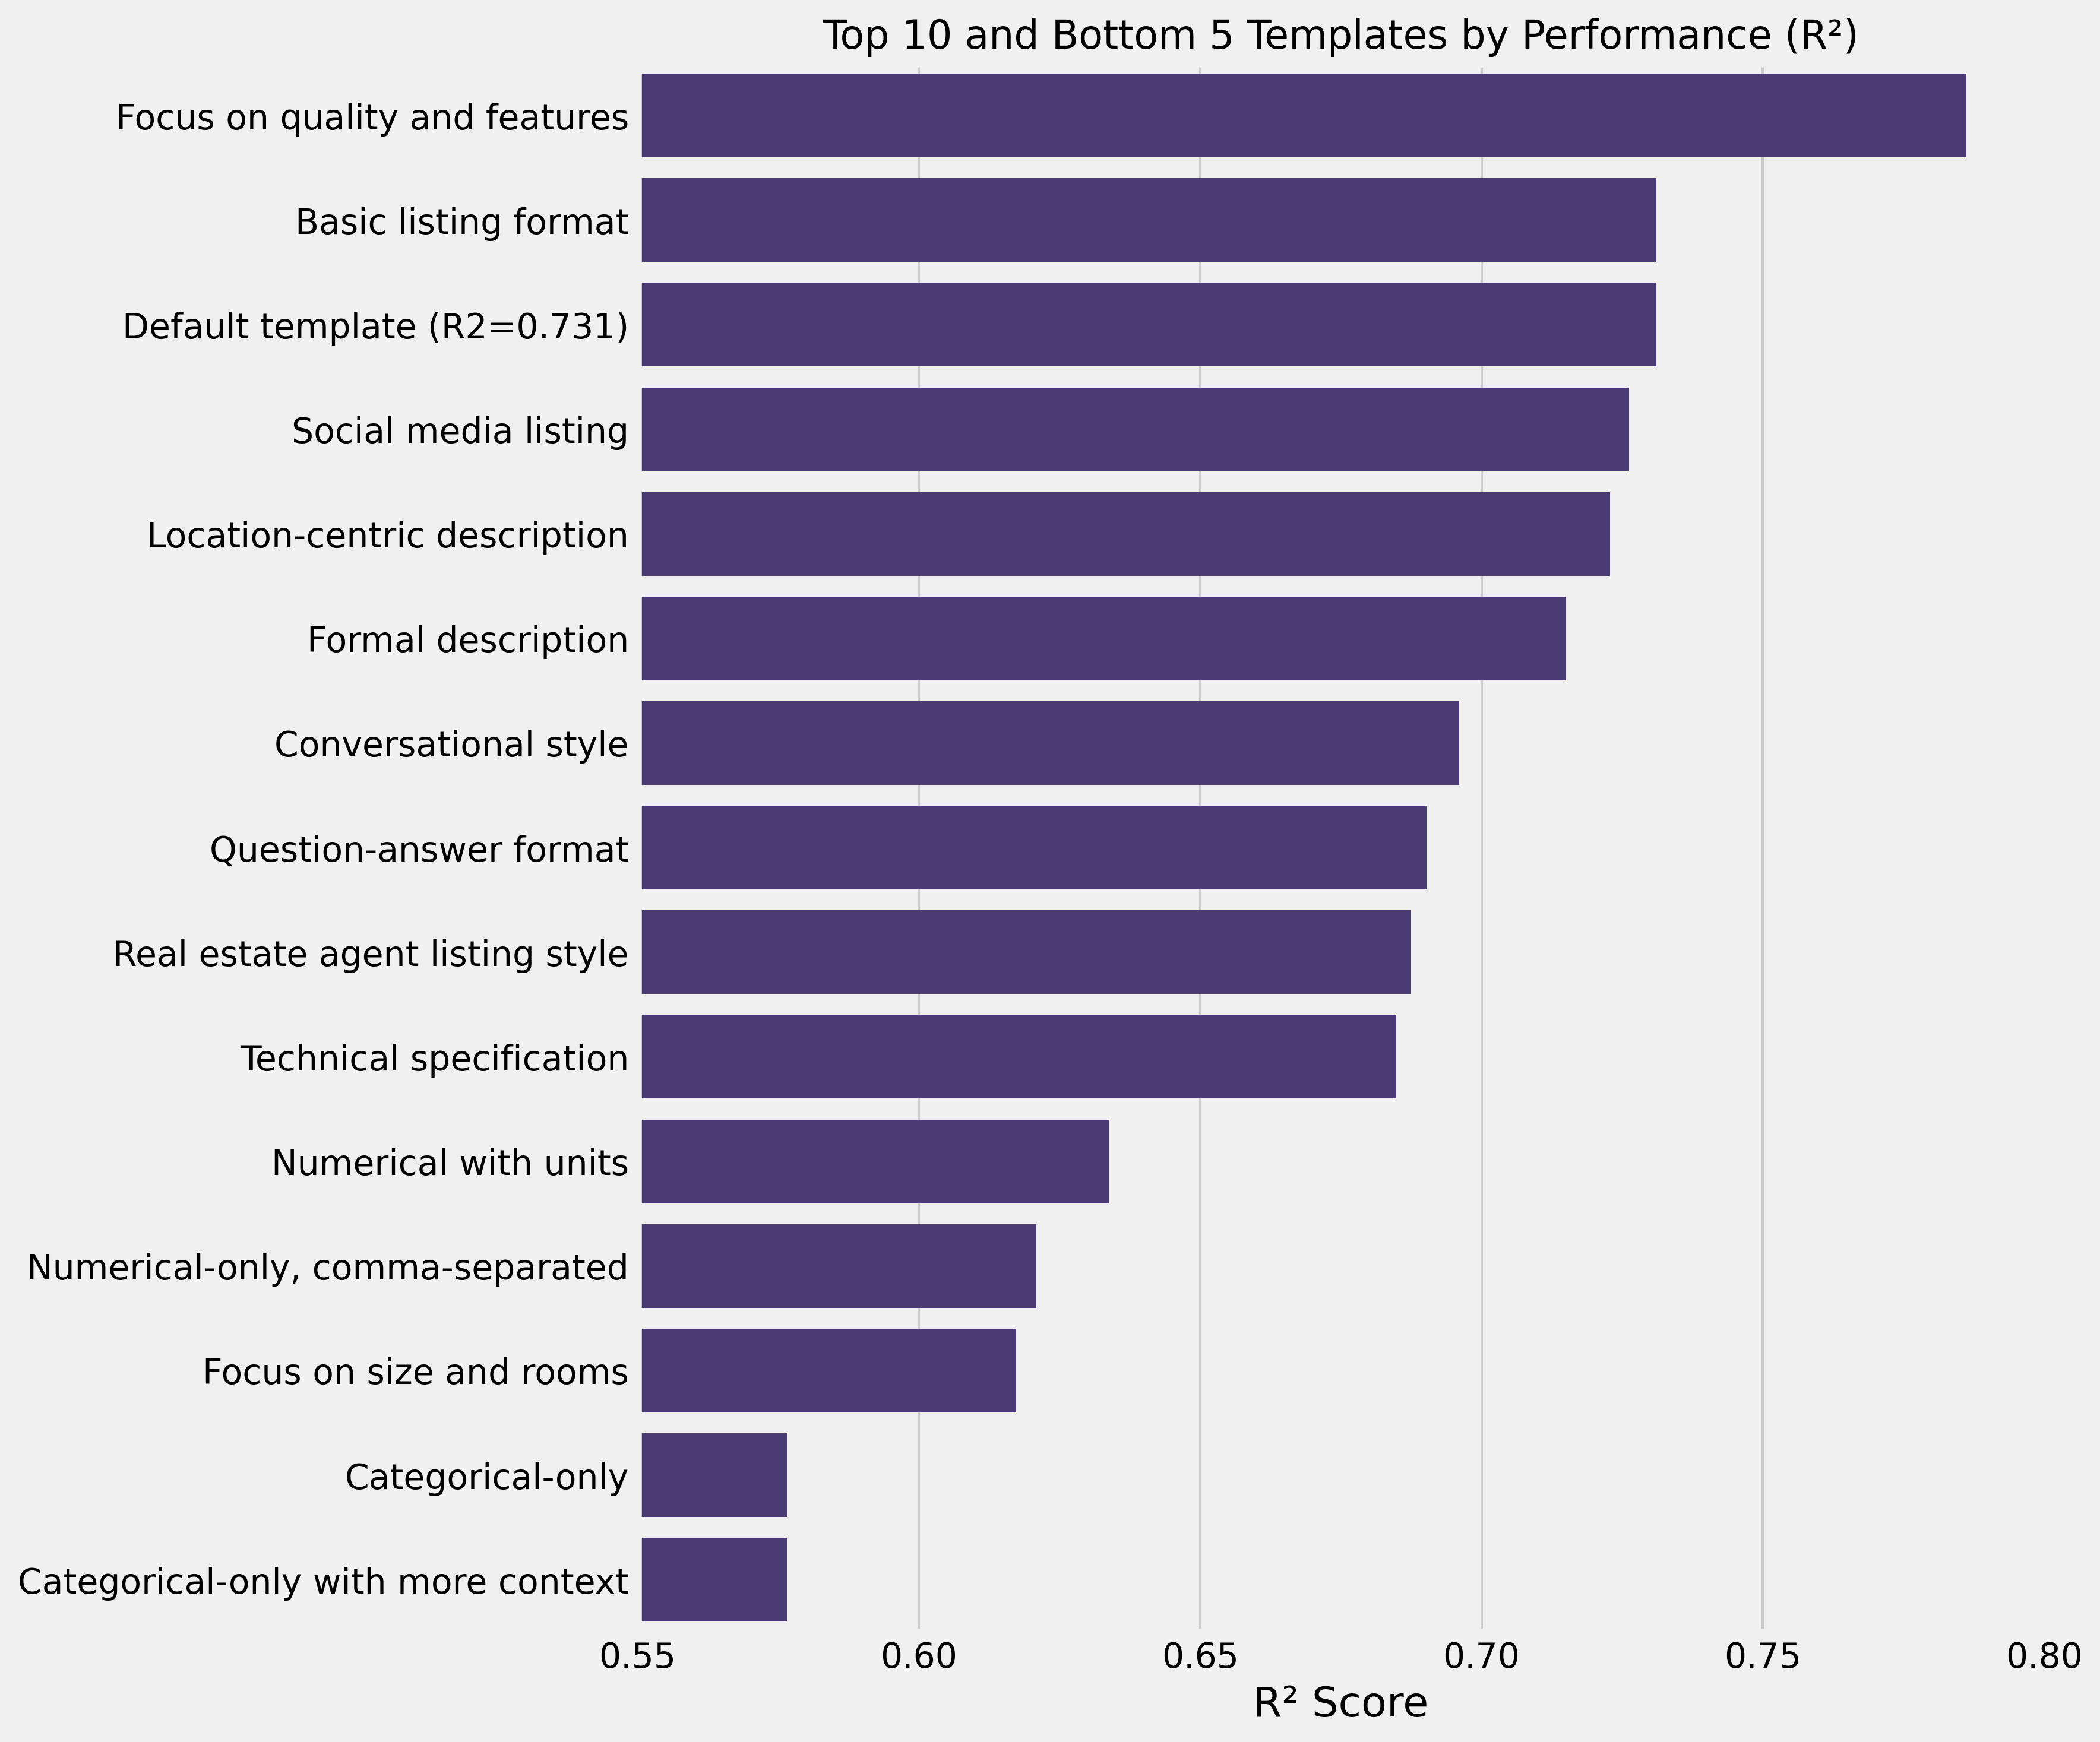
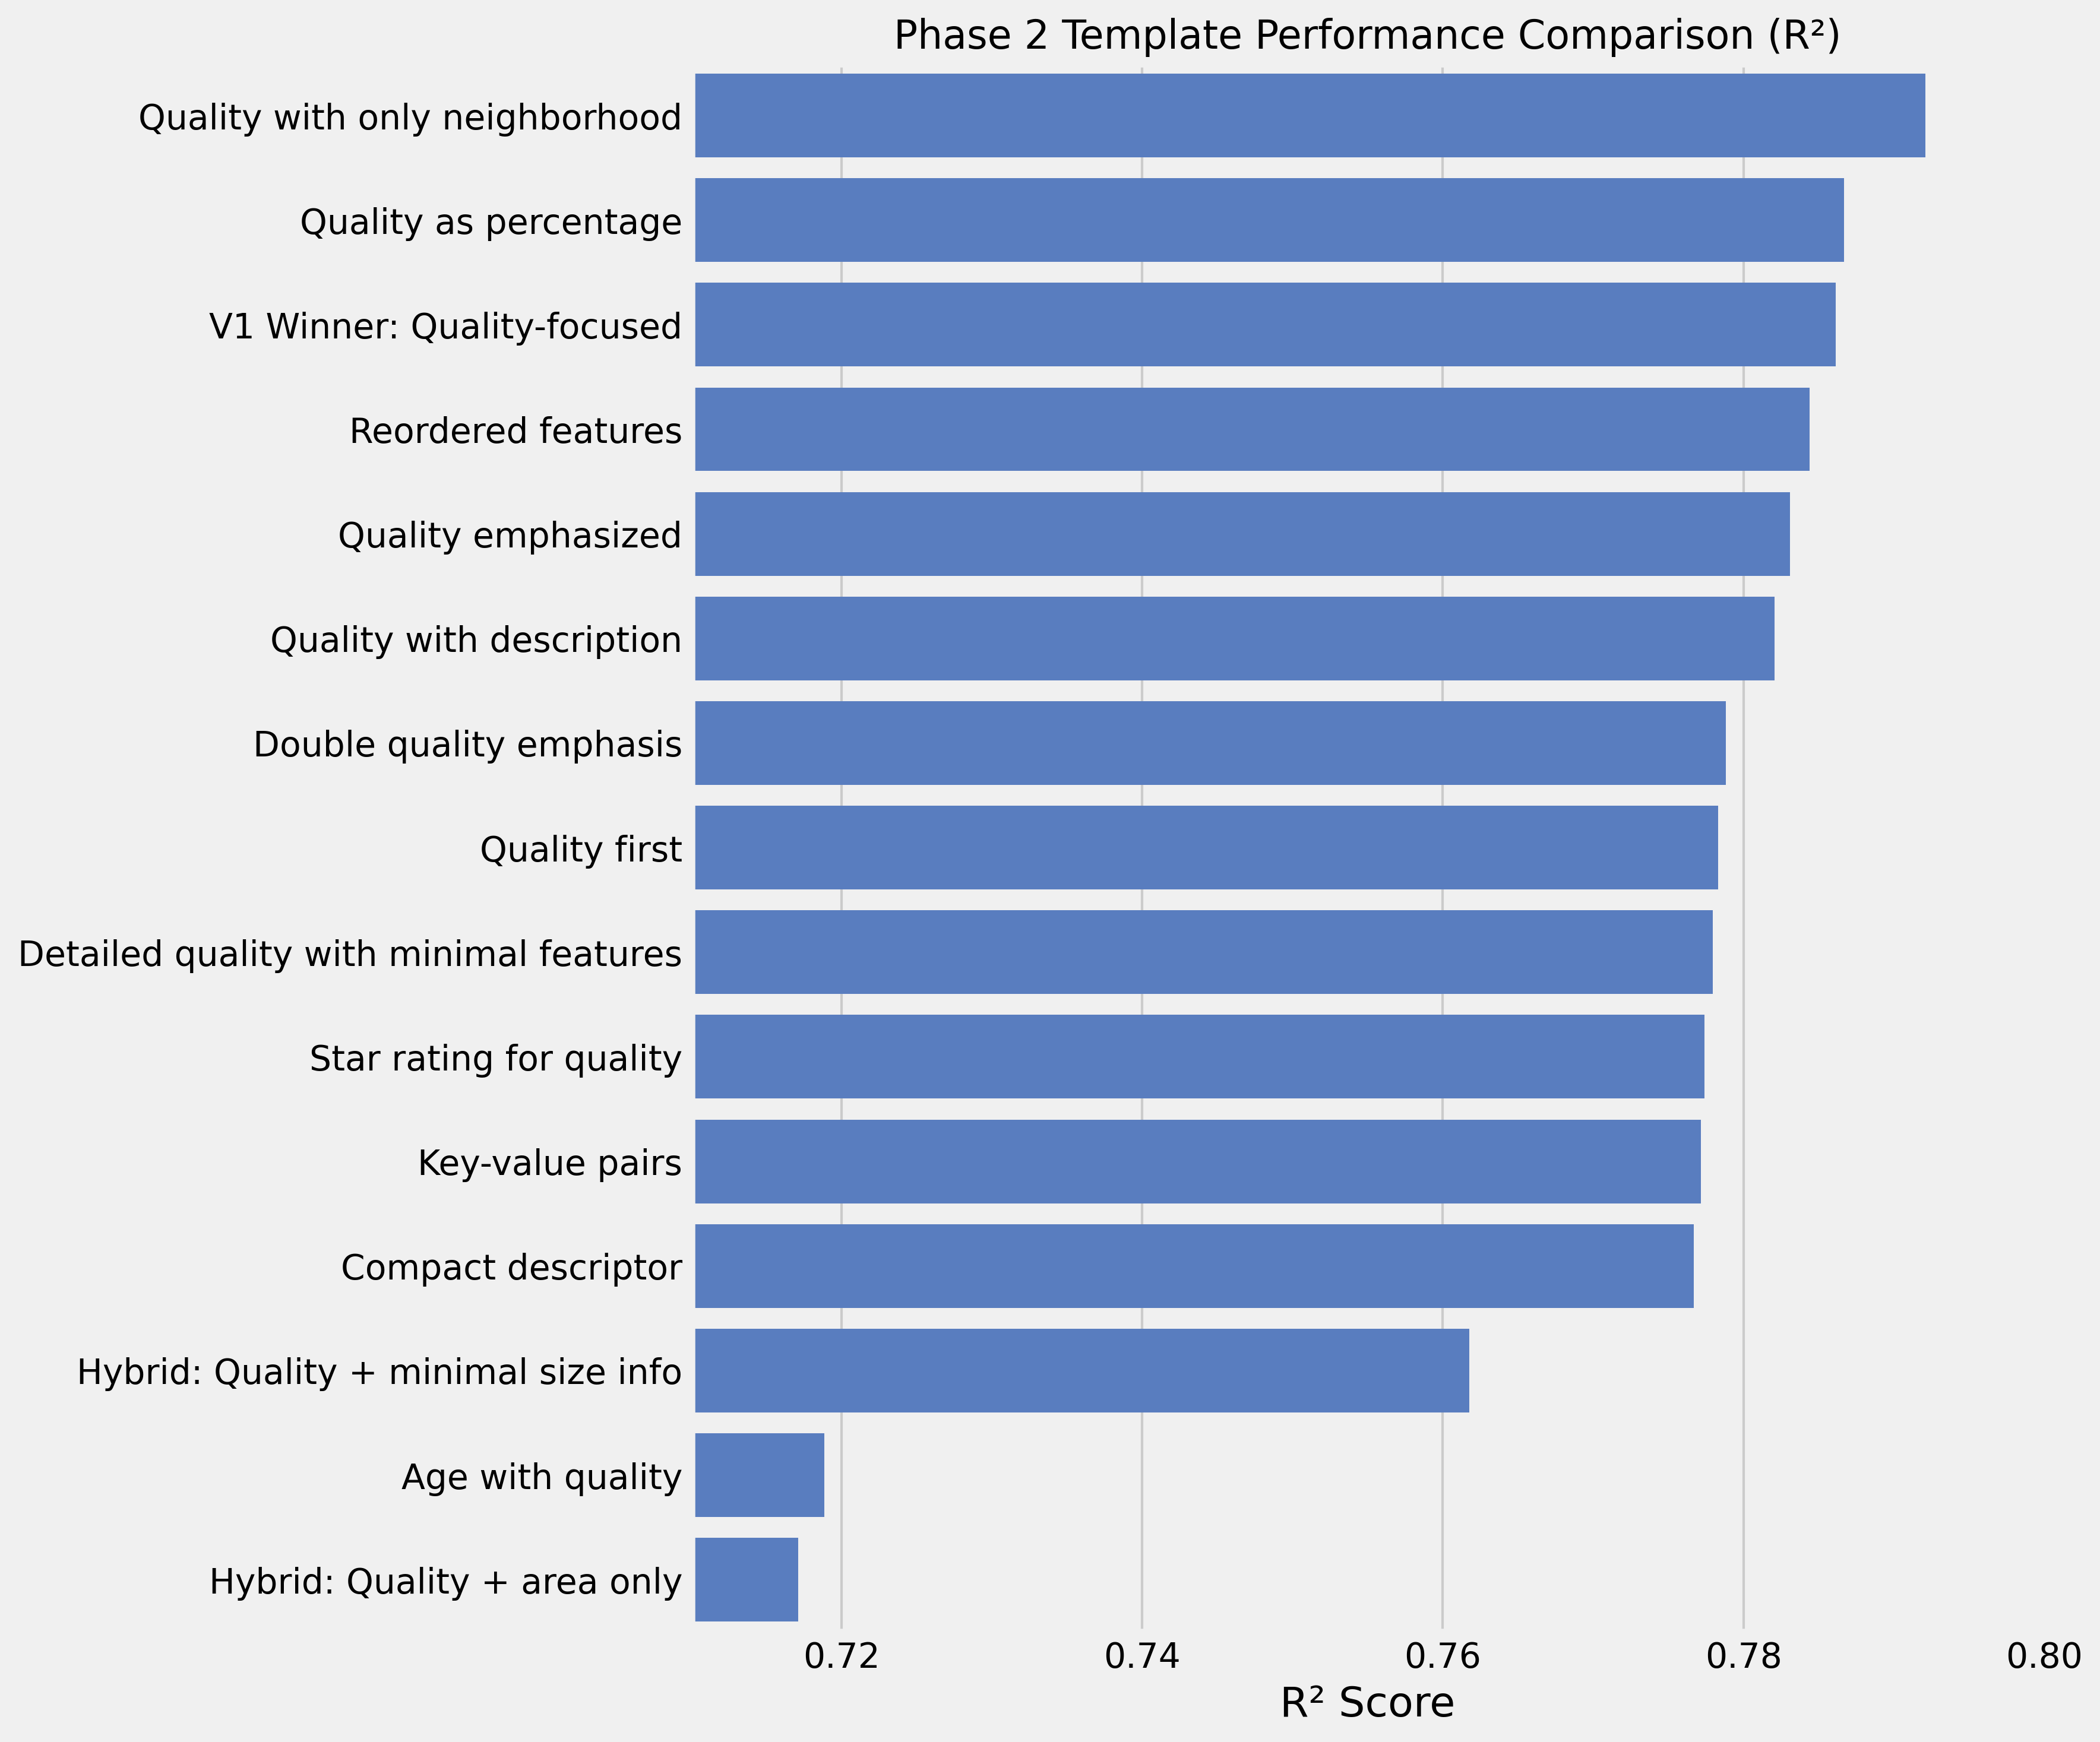
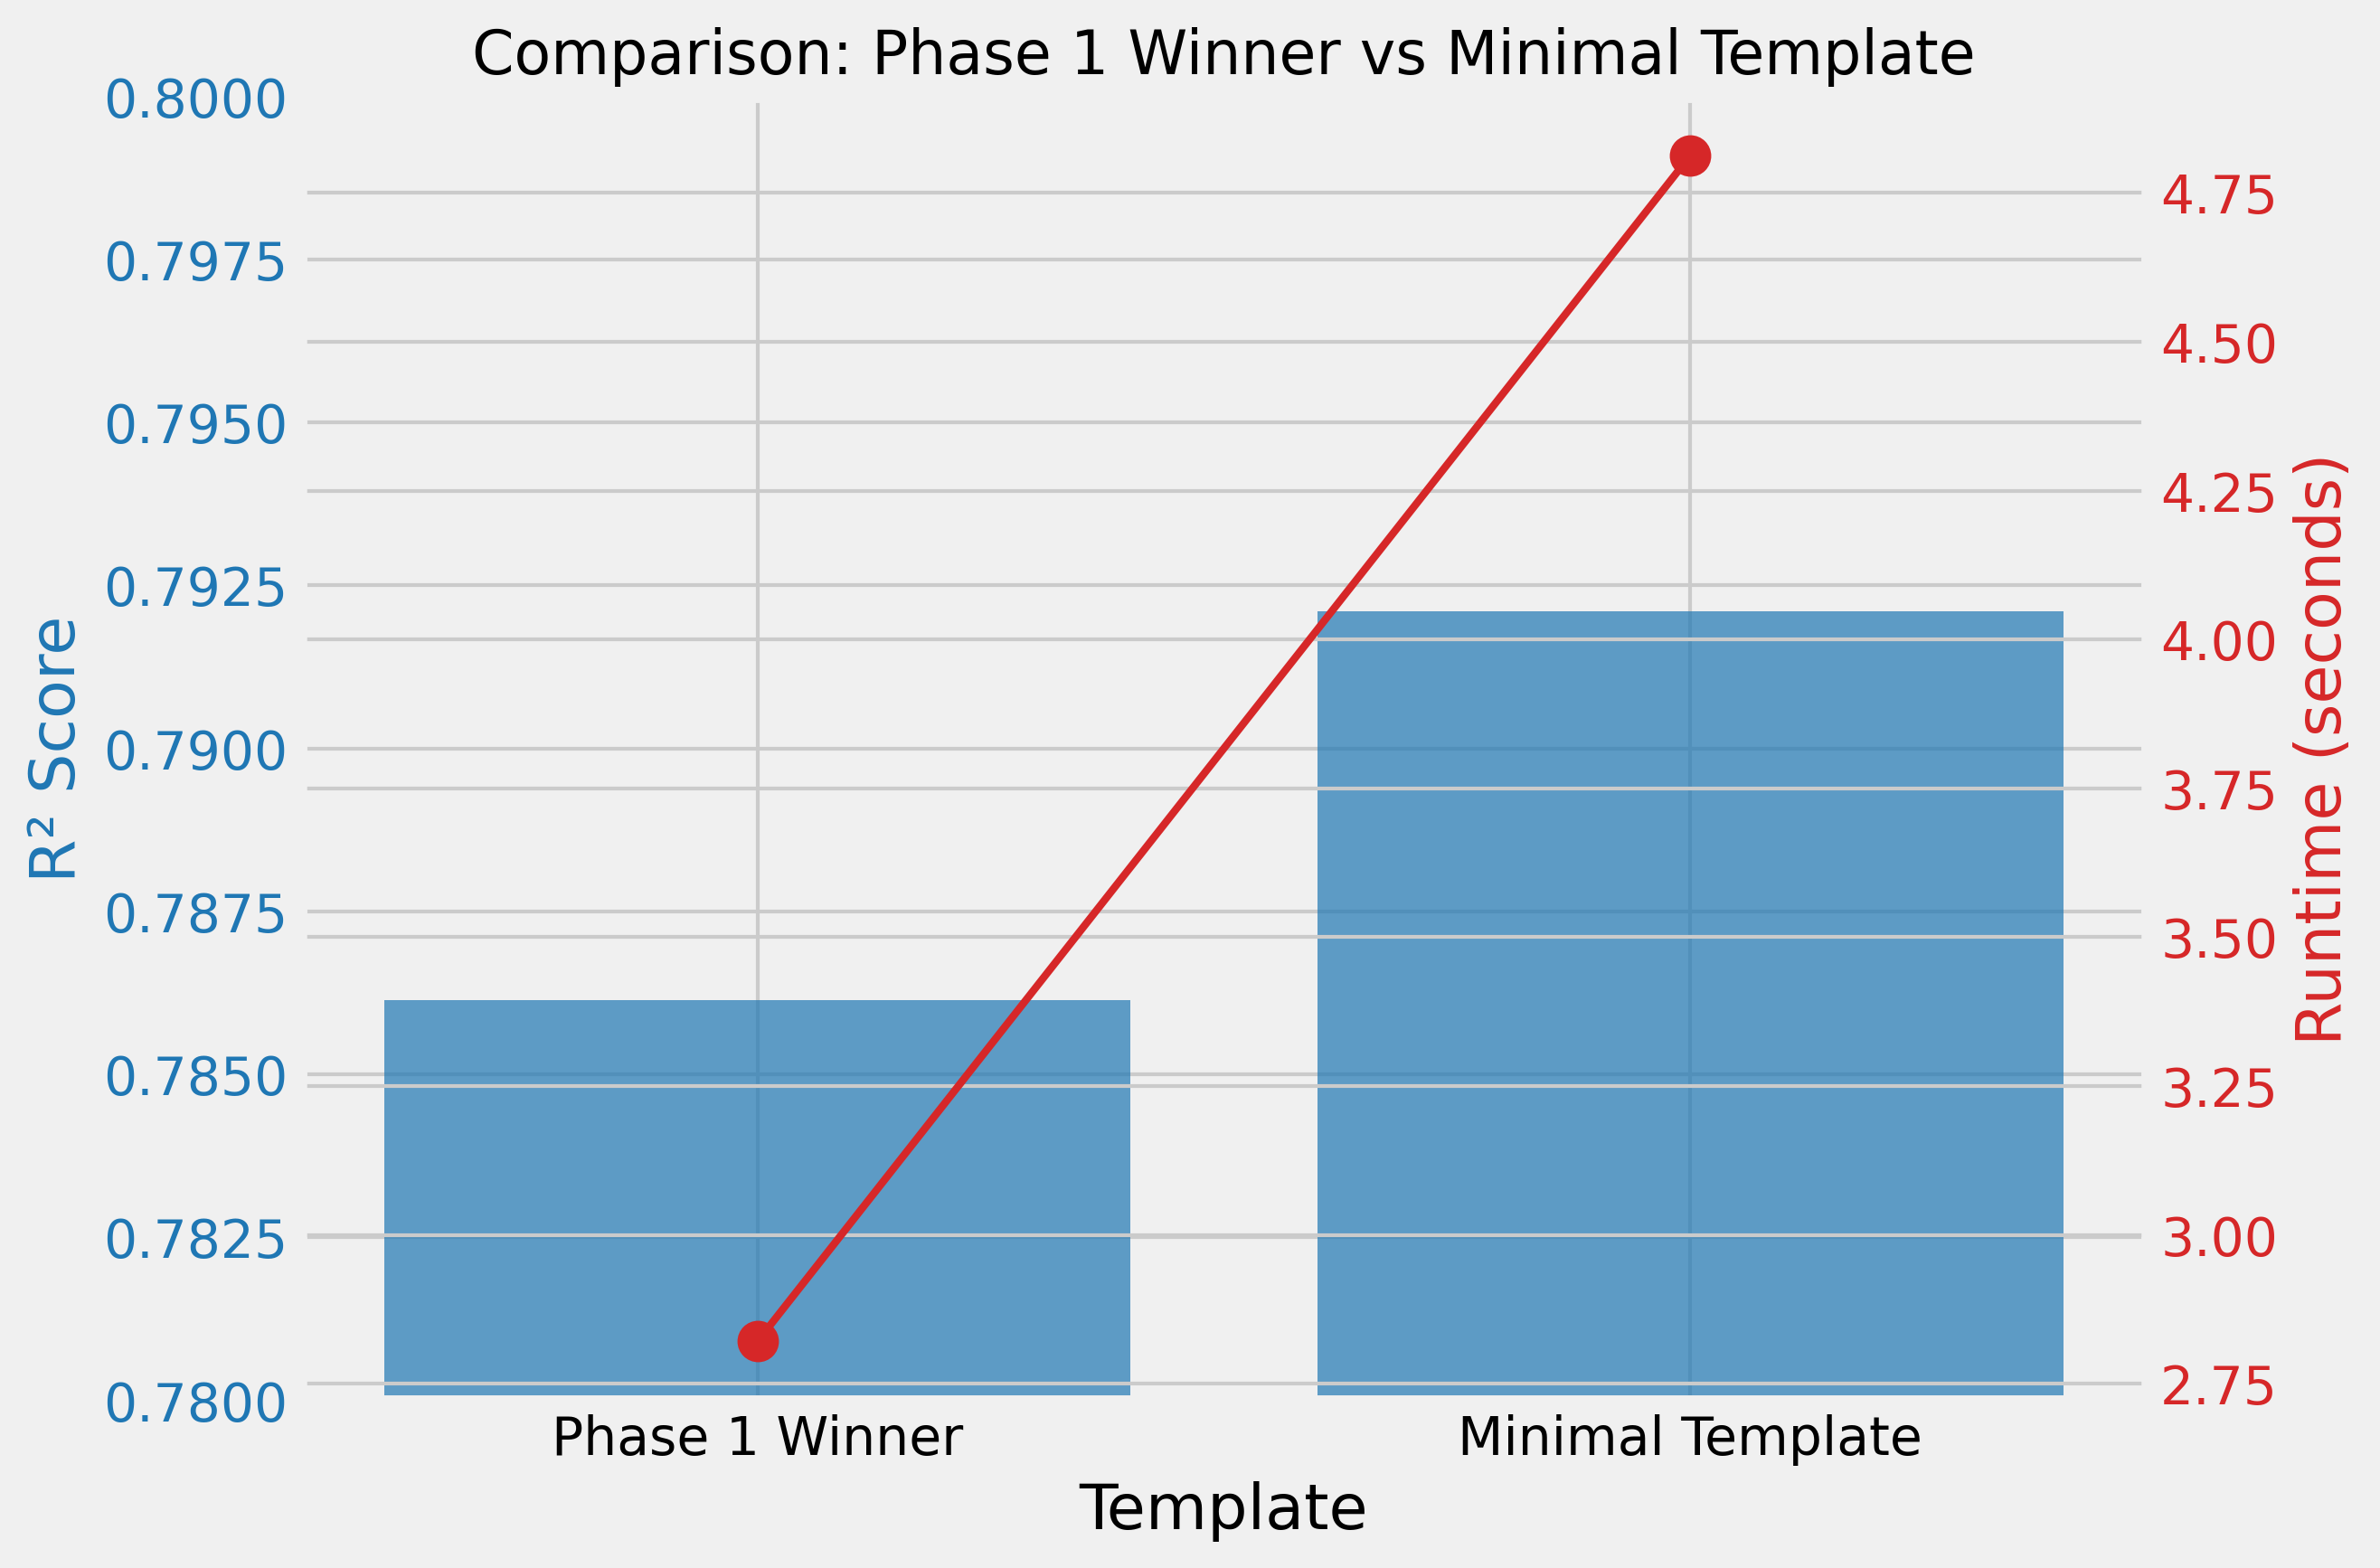
Phase 2: Minimalism is Key
A template with just quality + neighborhood outperformed more complex ones:
Quality rating: {quality}/10. Neighborhood: {neighborhood}.R² of 0.79 — sometimes less is more.
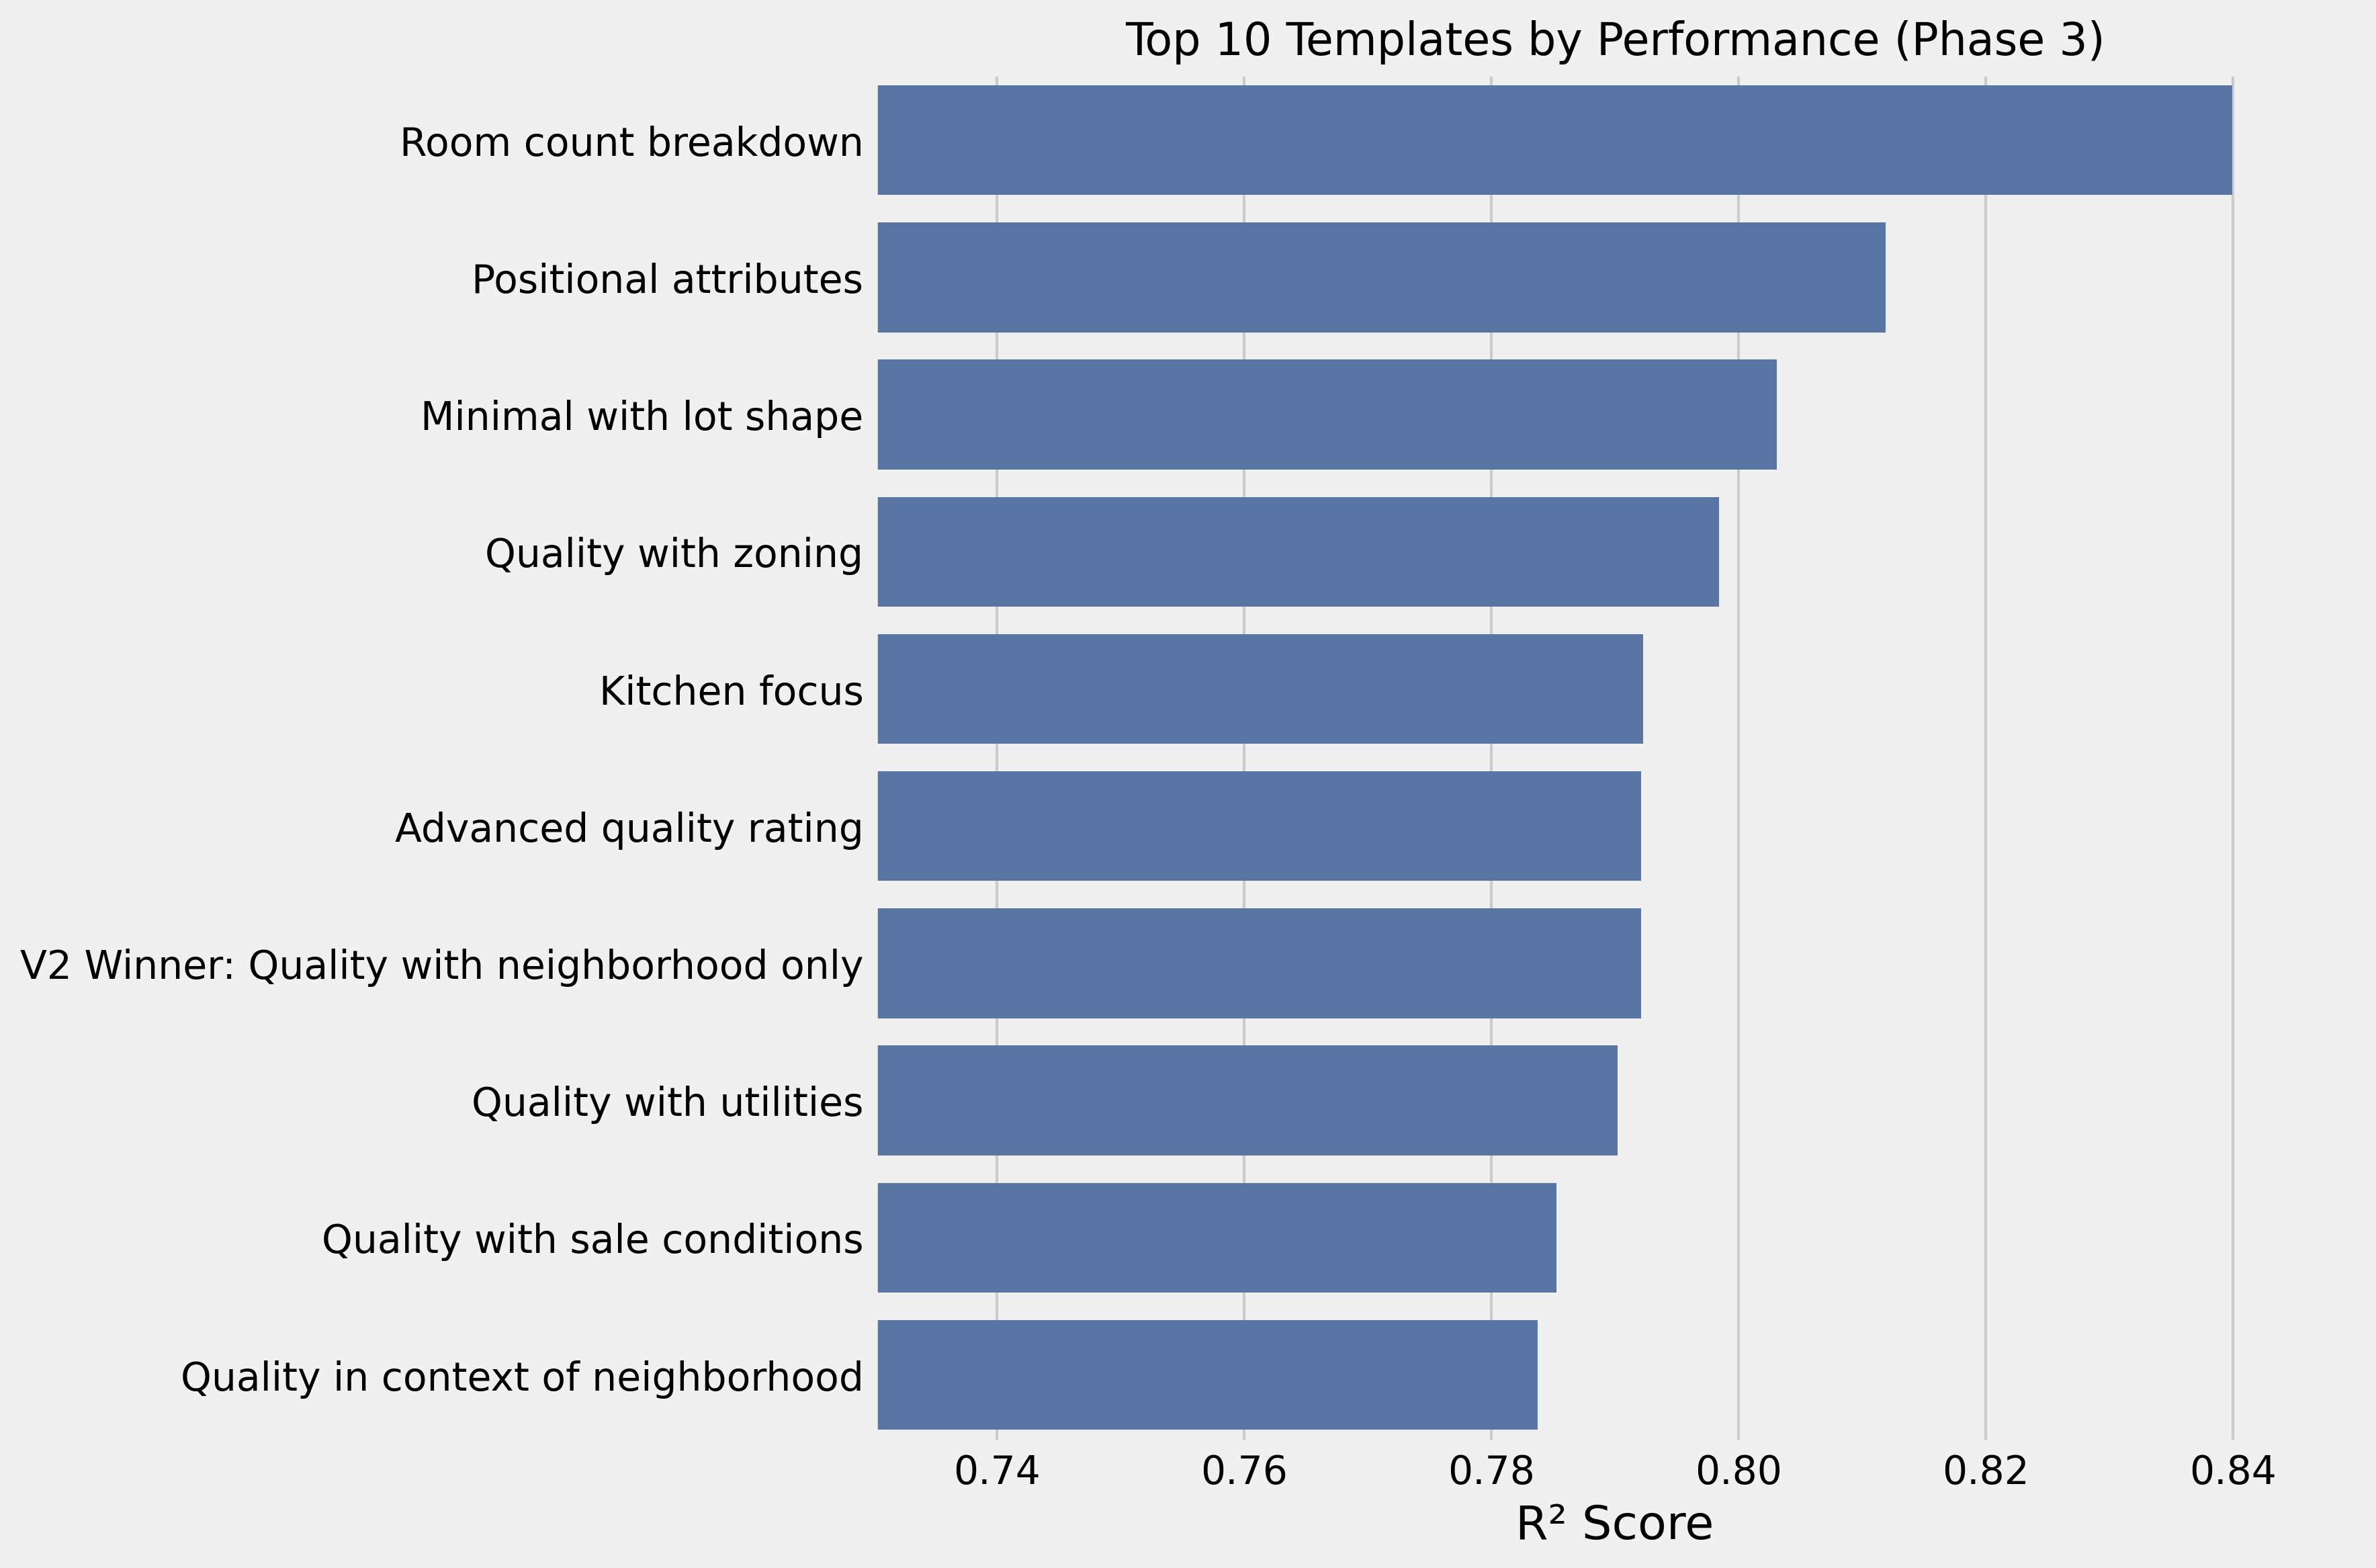
Phase 3: Strategic Feature Selection
Adding room counts to the minimal template jumped performance significantly:
Quality: {quality}/10. Neighborhood: {neighborhood}. Bedrooms: {bedrooms}.
Bathrooms: {bathrooms} (+{HalfBath} half). Basement baths: {BsmtFullBath} full +
{BsmtHalfBath} half. Total above-grade rooms: {TotRmsAbvGrd}.
Kitchens: {KitchenAbvGr}. Fireplaces: {Fireplaces}.
R² of 0.84 — the best result so far.
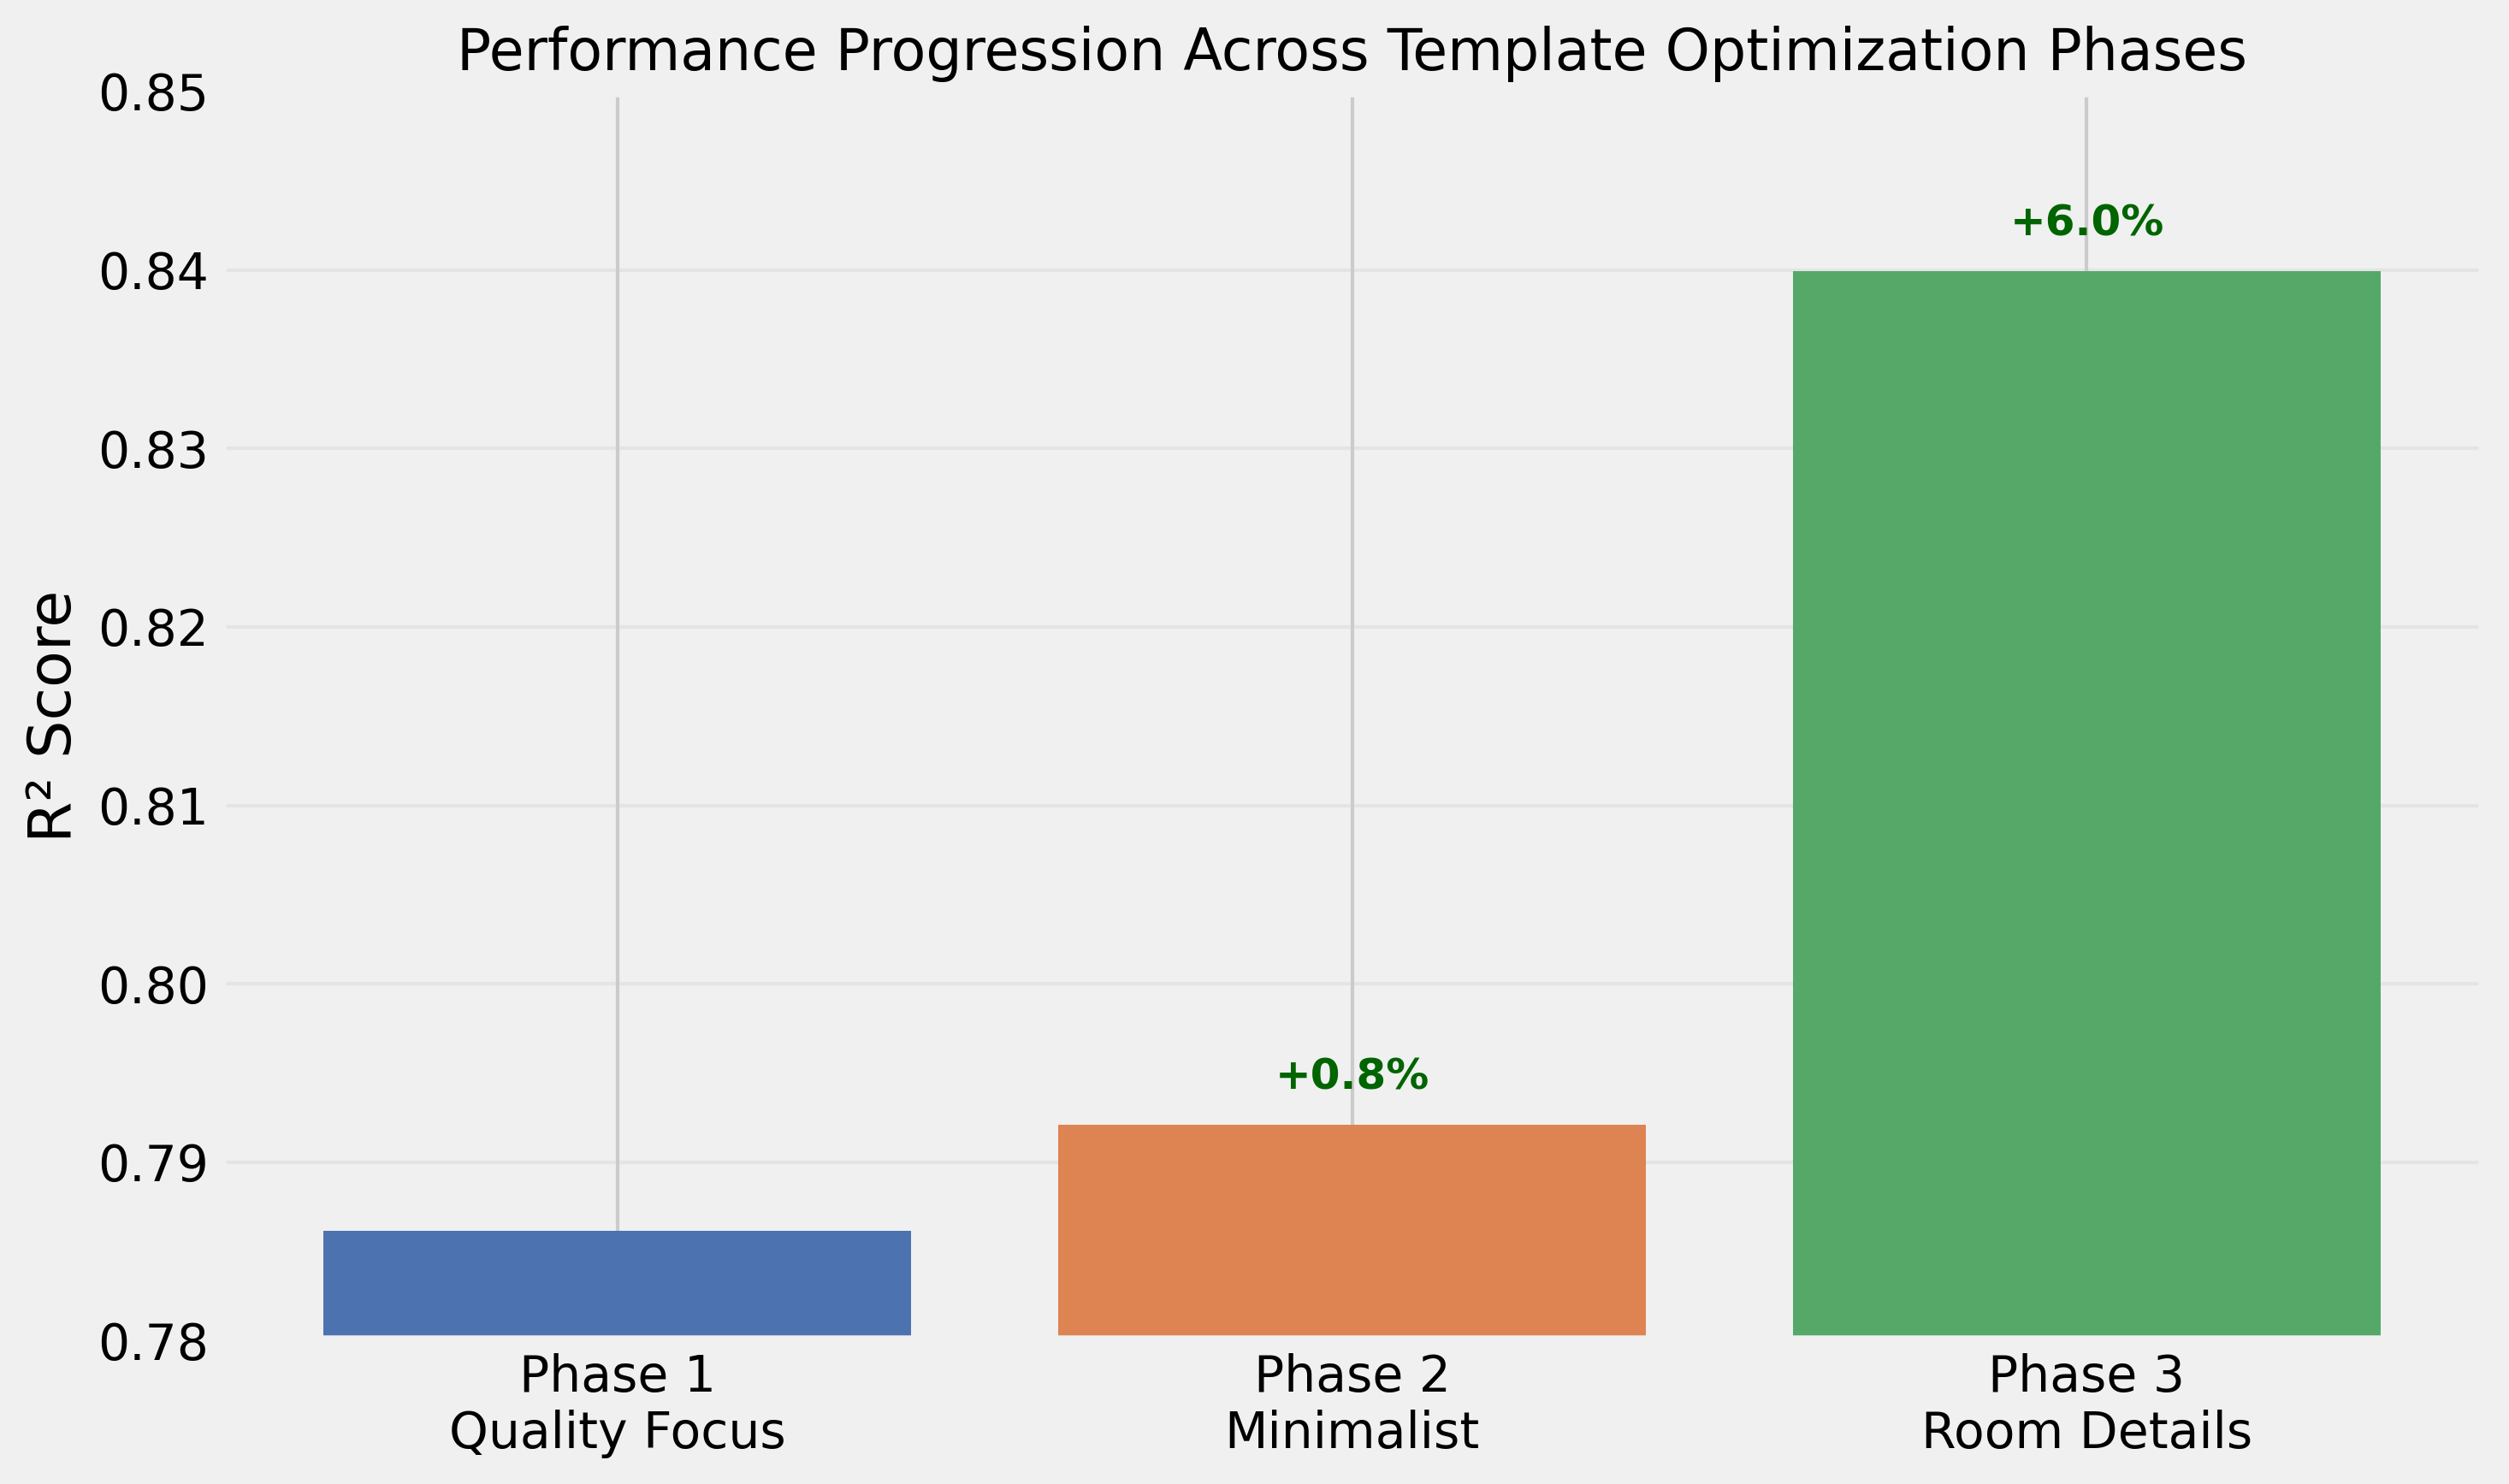
What We’ve Learned So Far
Performance Progression
| Stage | Best Approach | R² | Improvement |
|---|---|---|---|
| Initial Default | Standard property listing | 0.731 | Baseline |
| Phase 1 | Quality + features focus | 0.786 | +7.5% |
| Phase 2 | Quality + neighborhood only | 0.792 | +0.8% |
| Phase 3 | Room count details | 0.840 | +6.1% |
Template Structure Insights
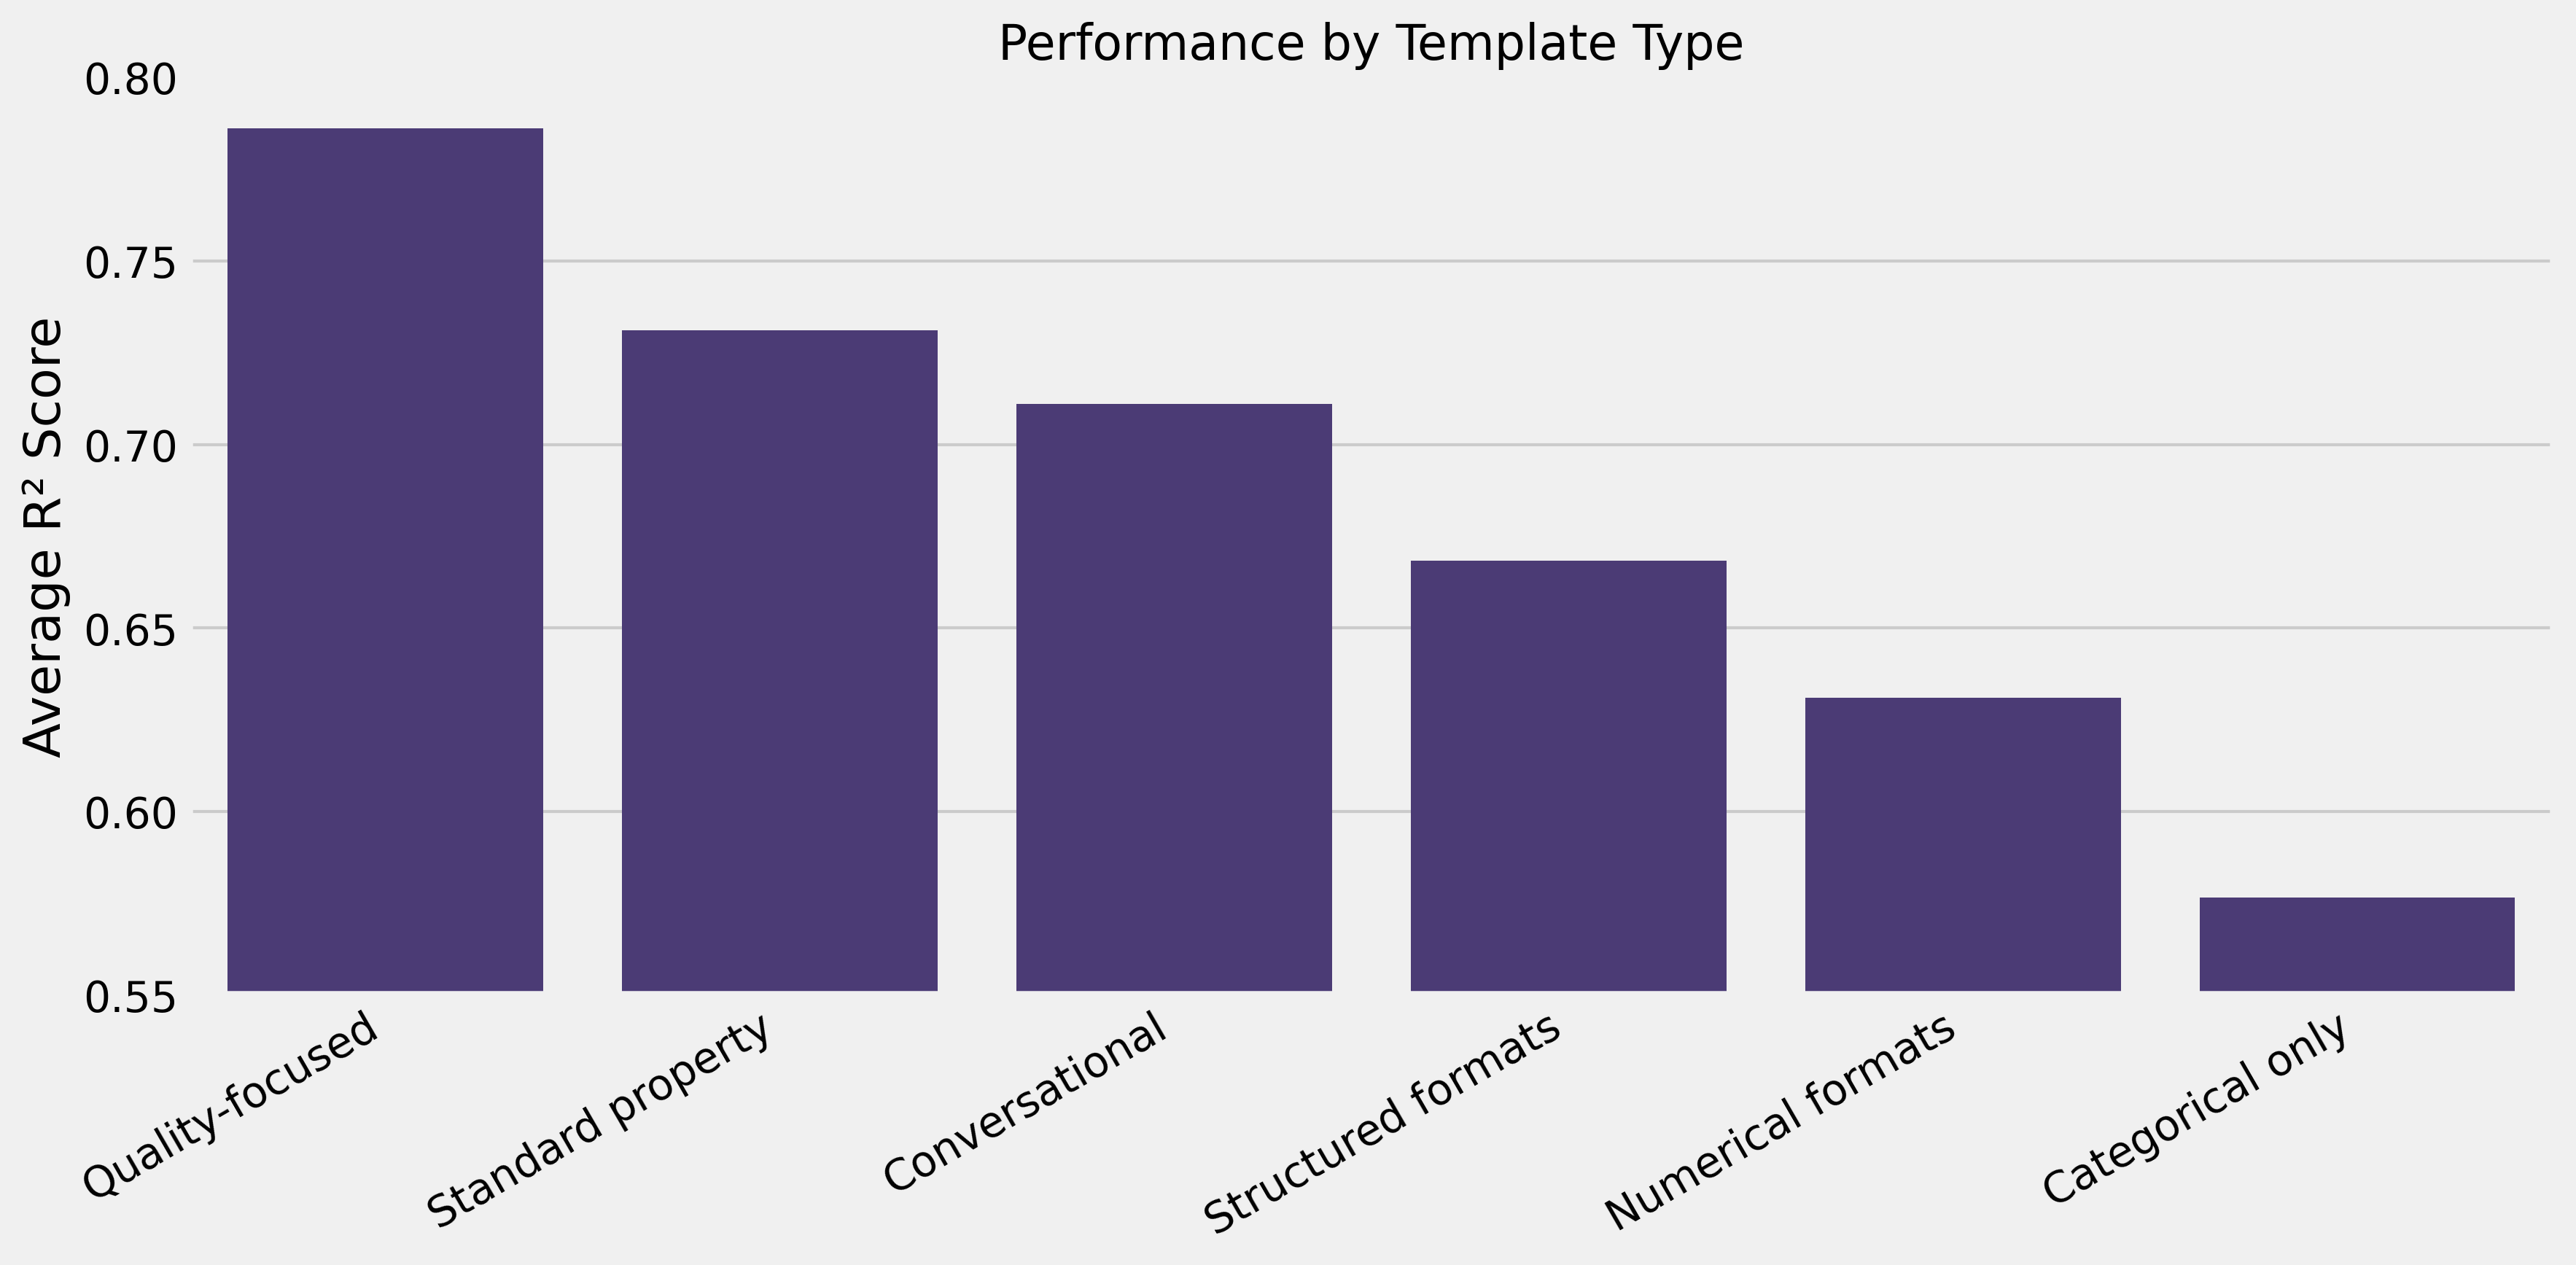
- Human-readable narratives outperform data lists: natural language (R² 0.73–0.84) vs. comma-separated values (R² 0.62) or keyword lists (R² 0.67)
- Contextual qualifiers help:
quality rating: {quality}/10beats raw{quality} - Order matters marginally: reordered identical content showed small differences (R² 0.784 vs. 0.786)
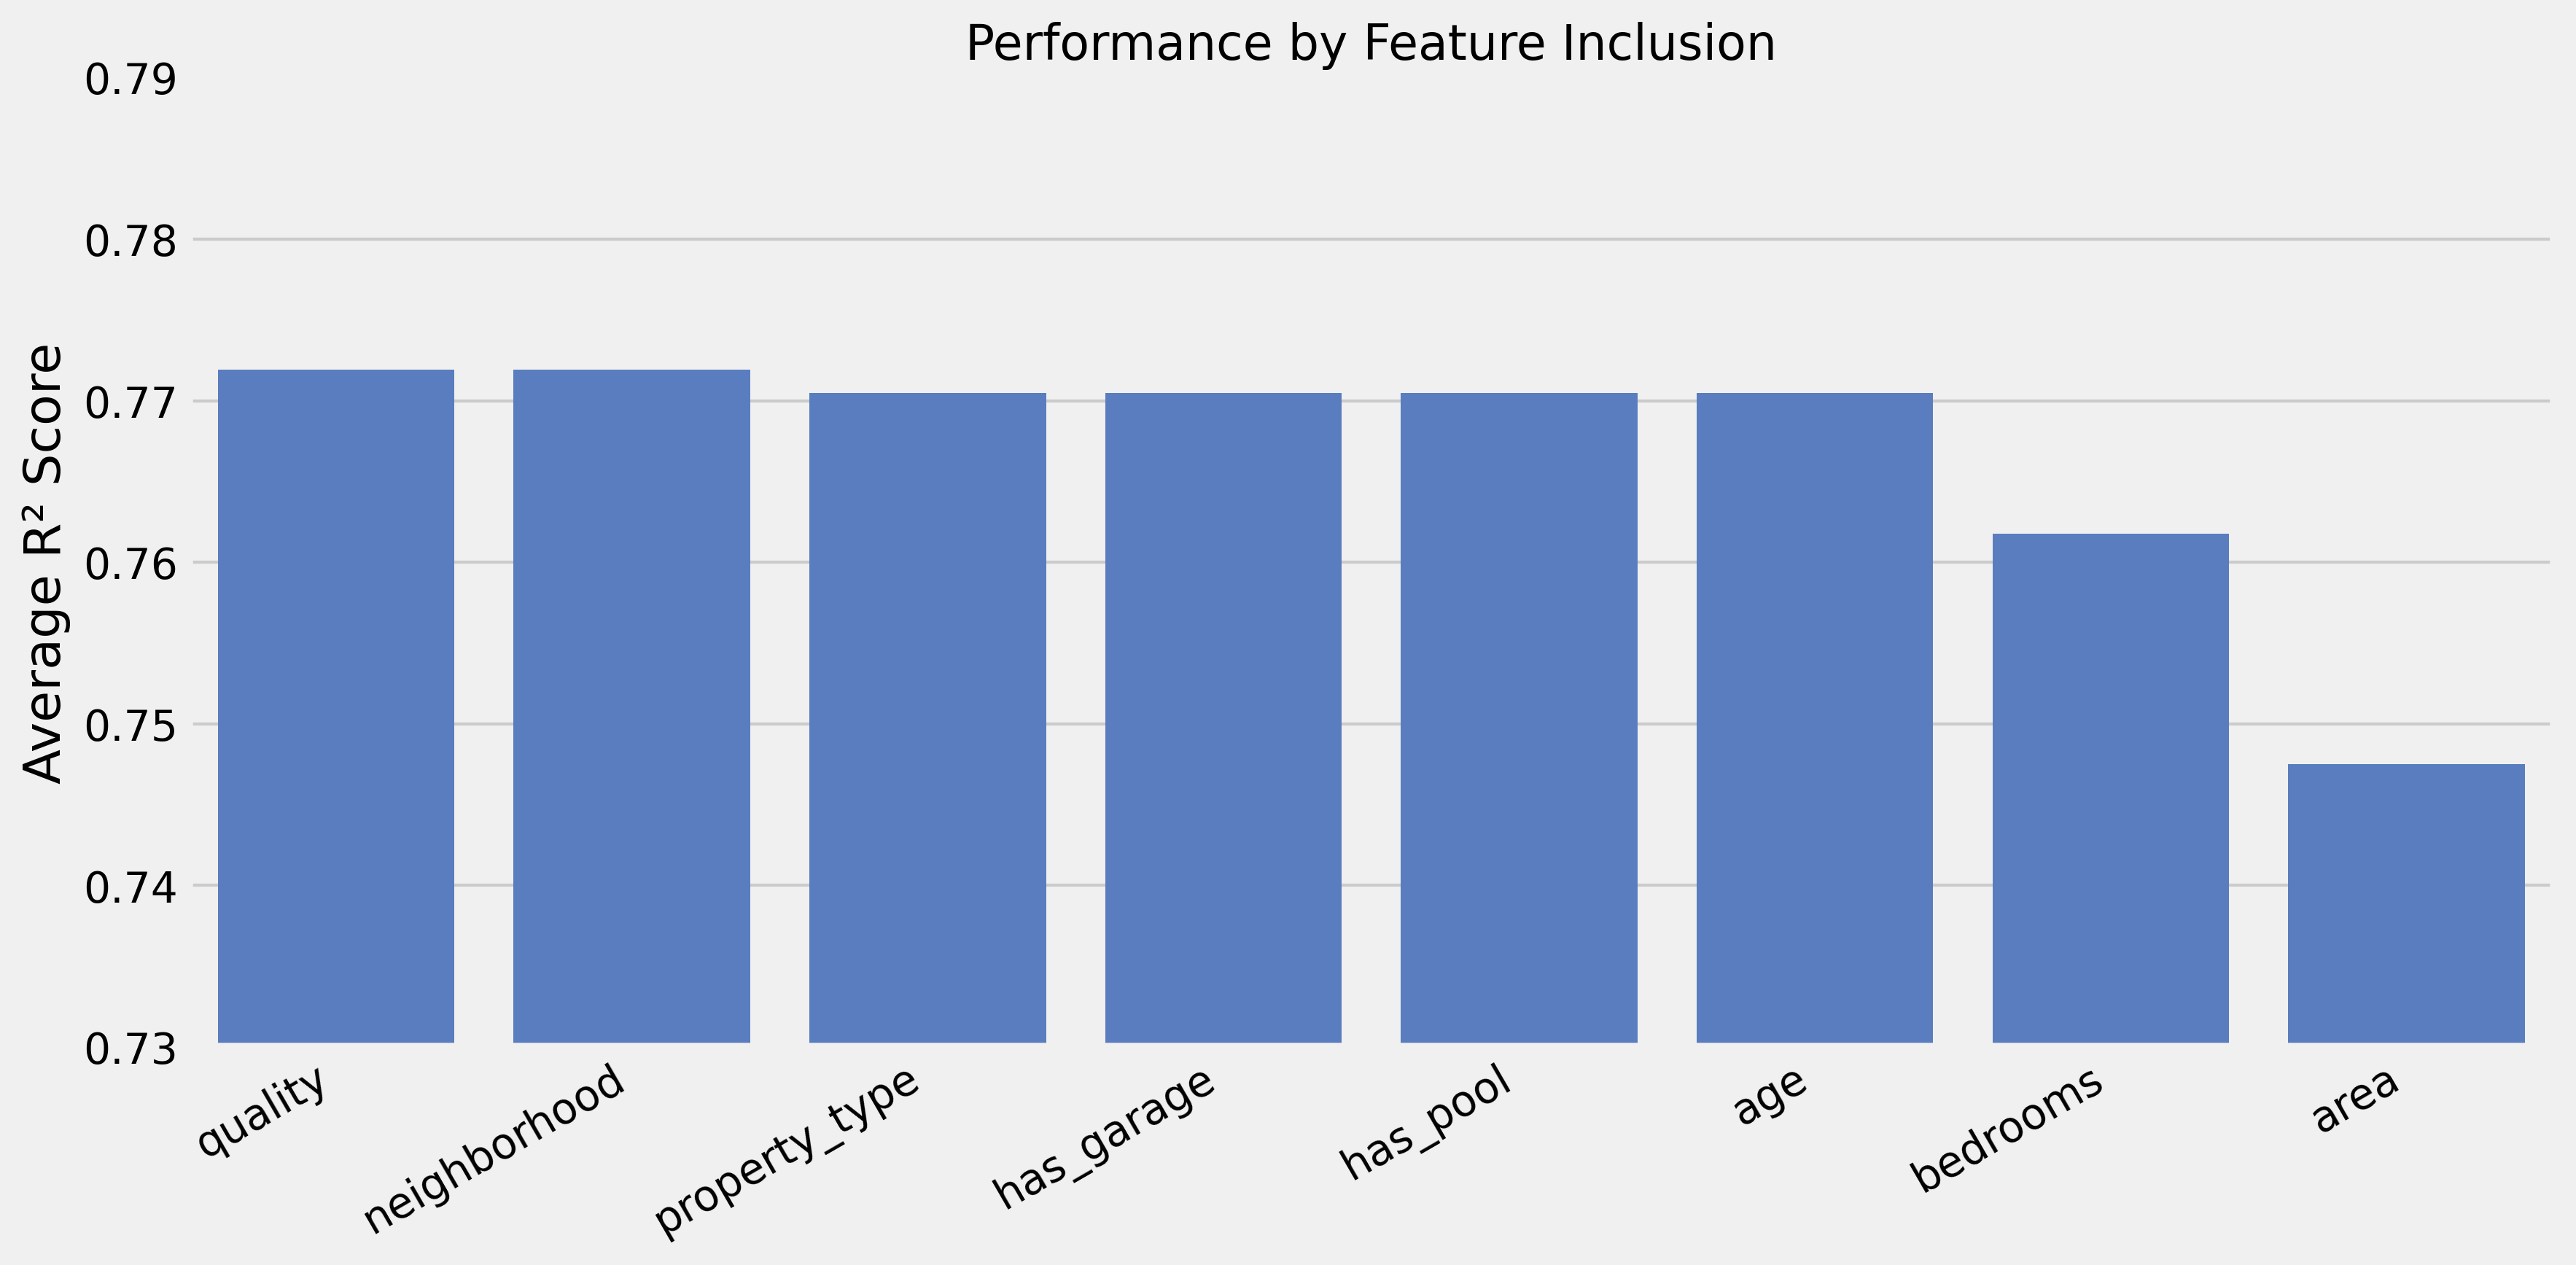
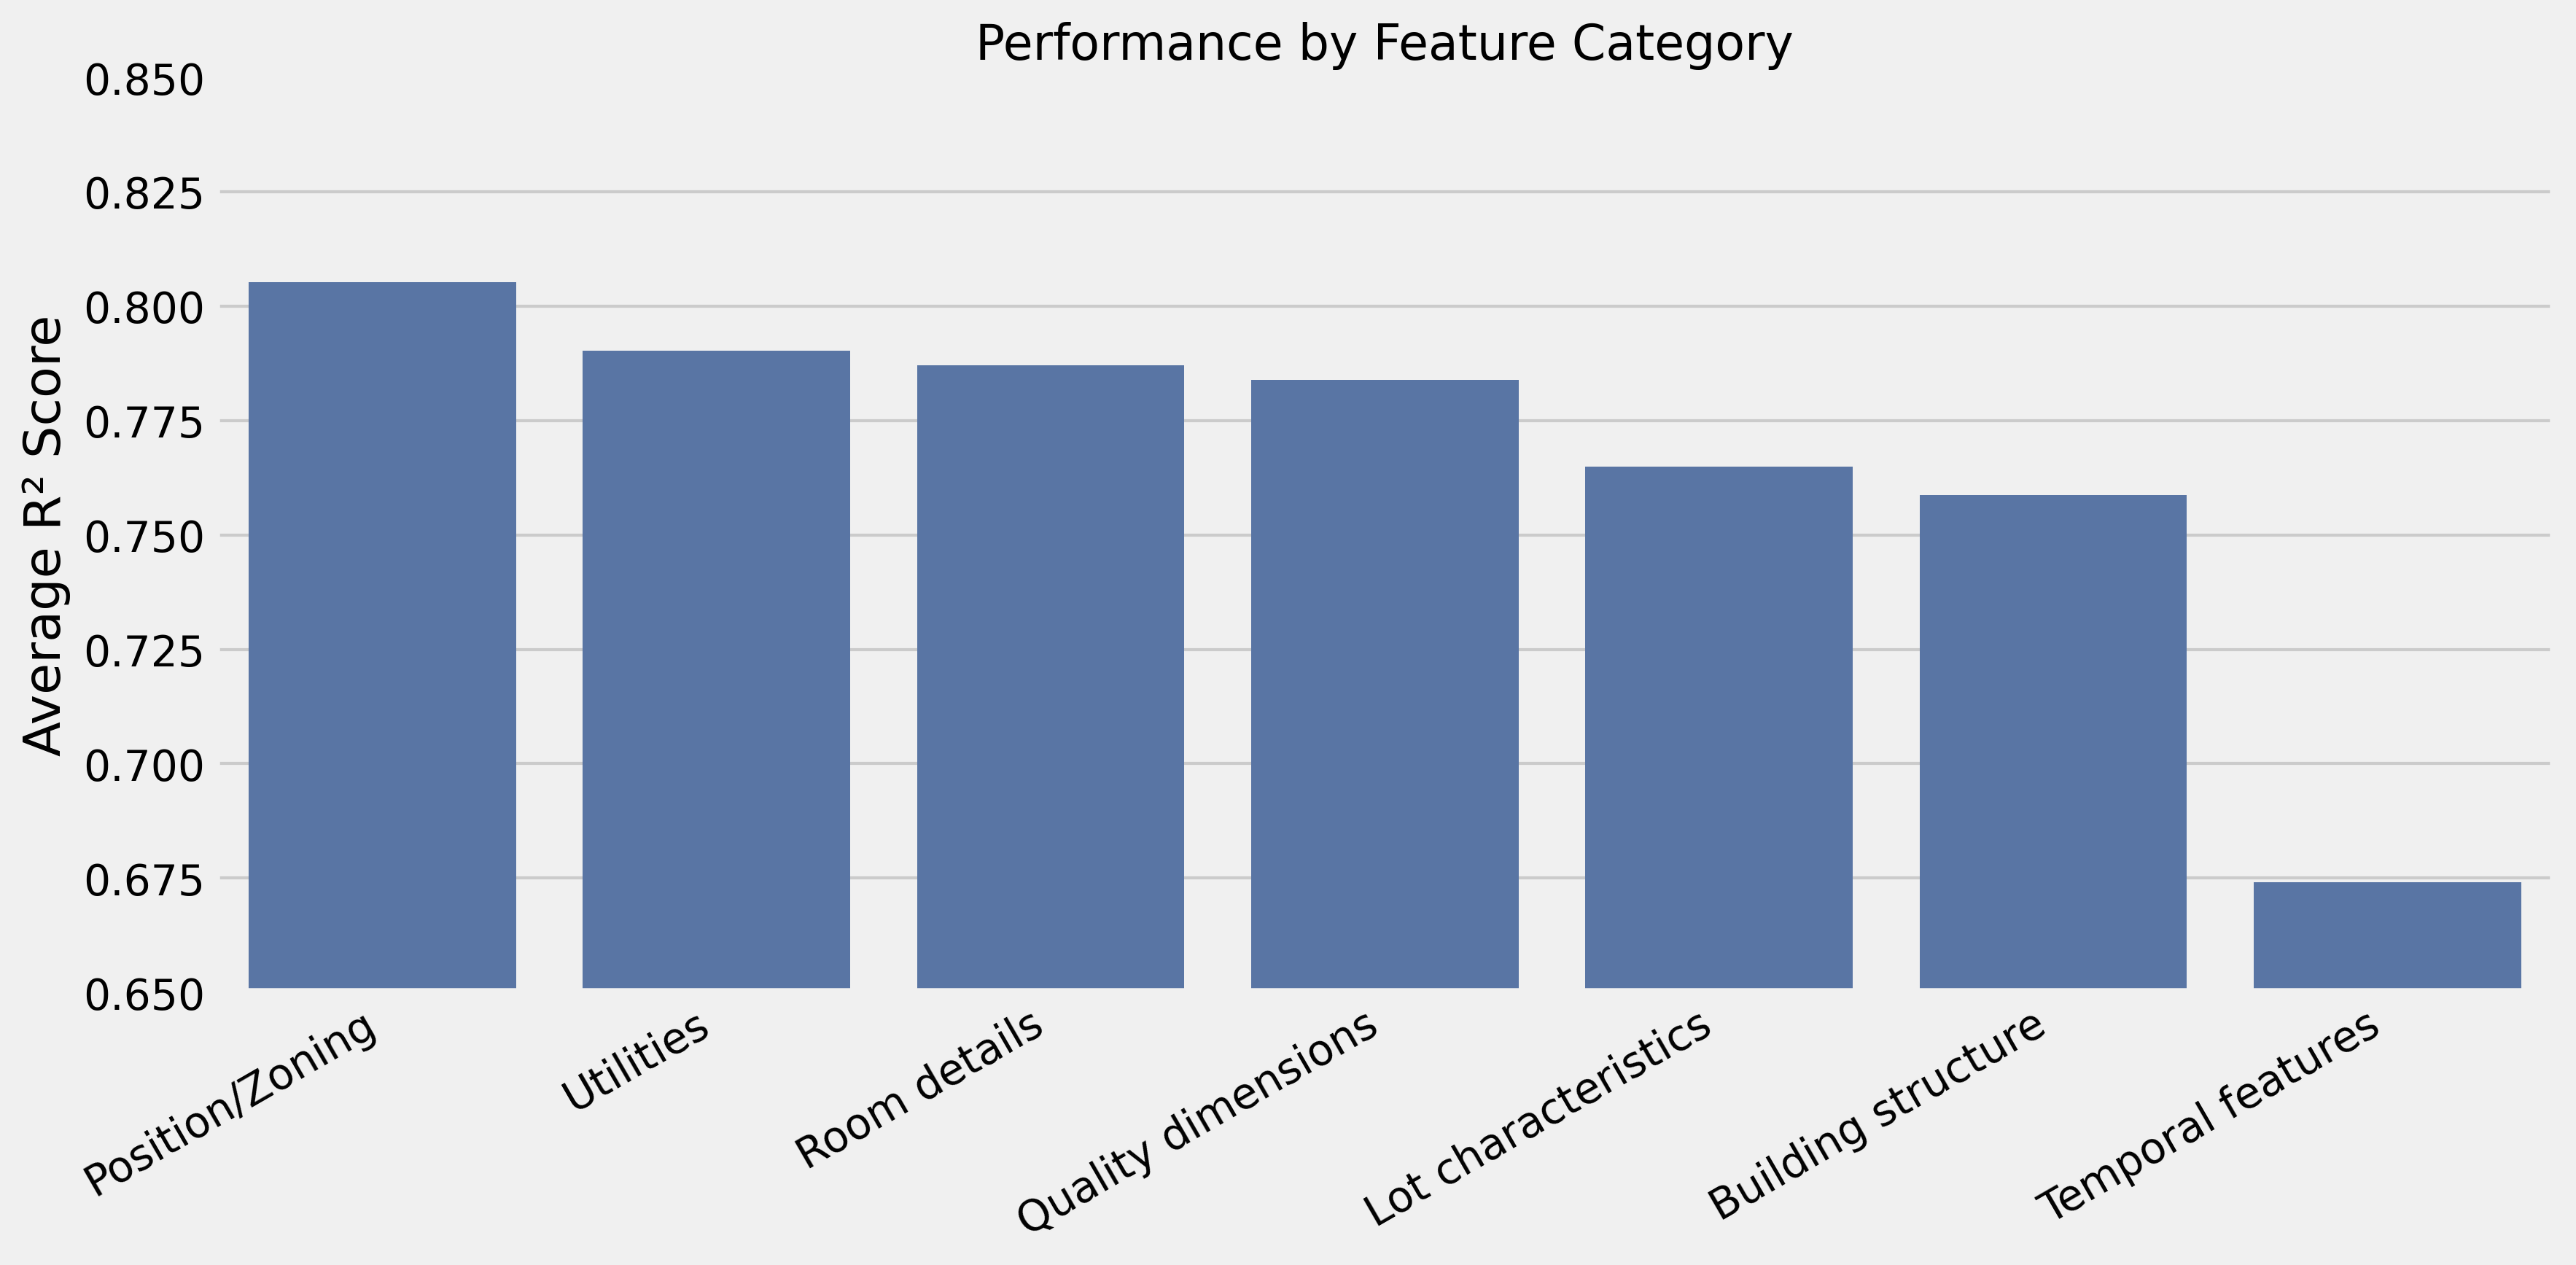
Feature Combination Effects
- Core: Quality + neighborhood → R² 0.792
- High-value additions: Room details (+0.048), lot shape (+0.011), zoning (+0.006)
- Hurts performance: Age information (−0.167), area measurements (−0.078)
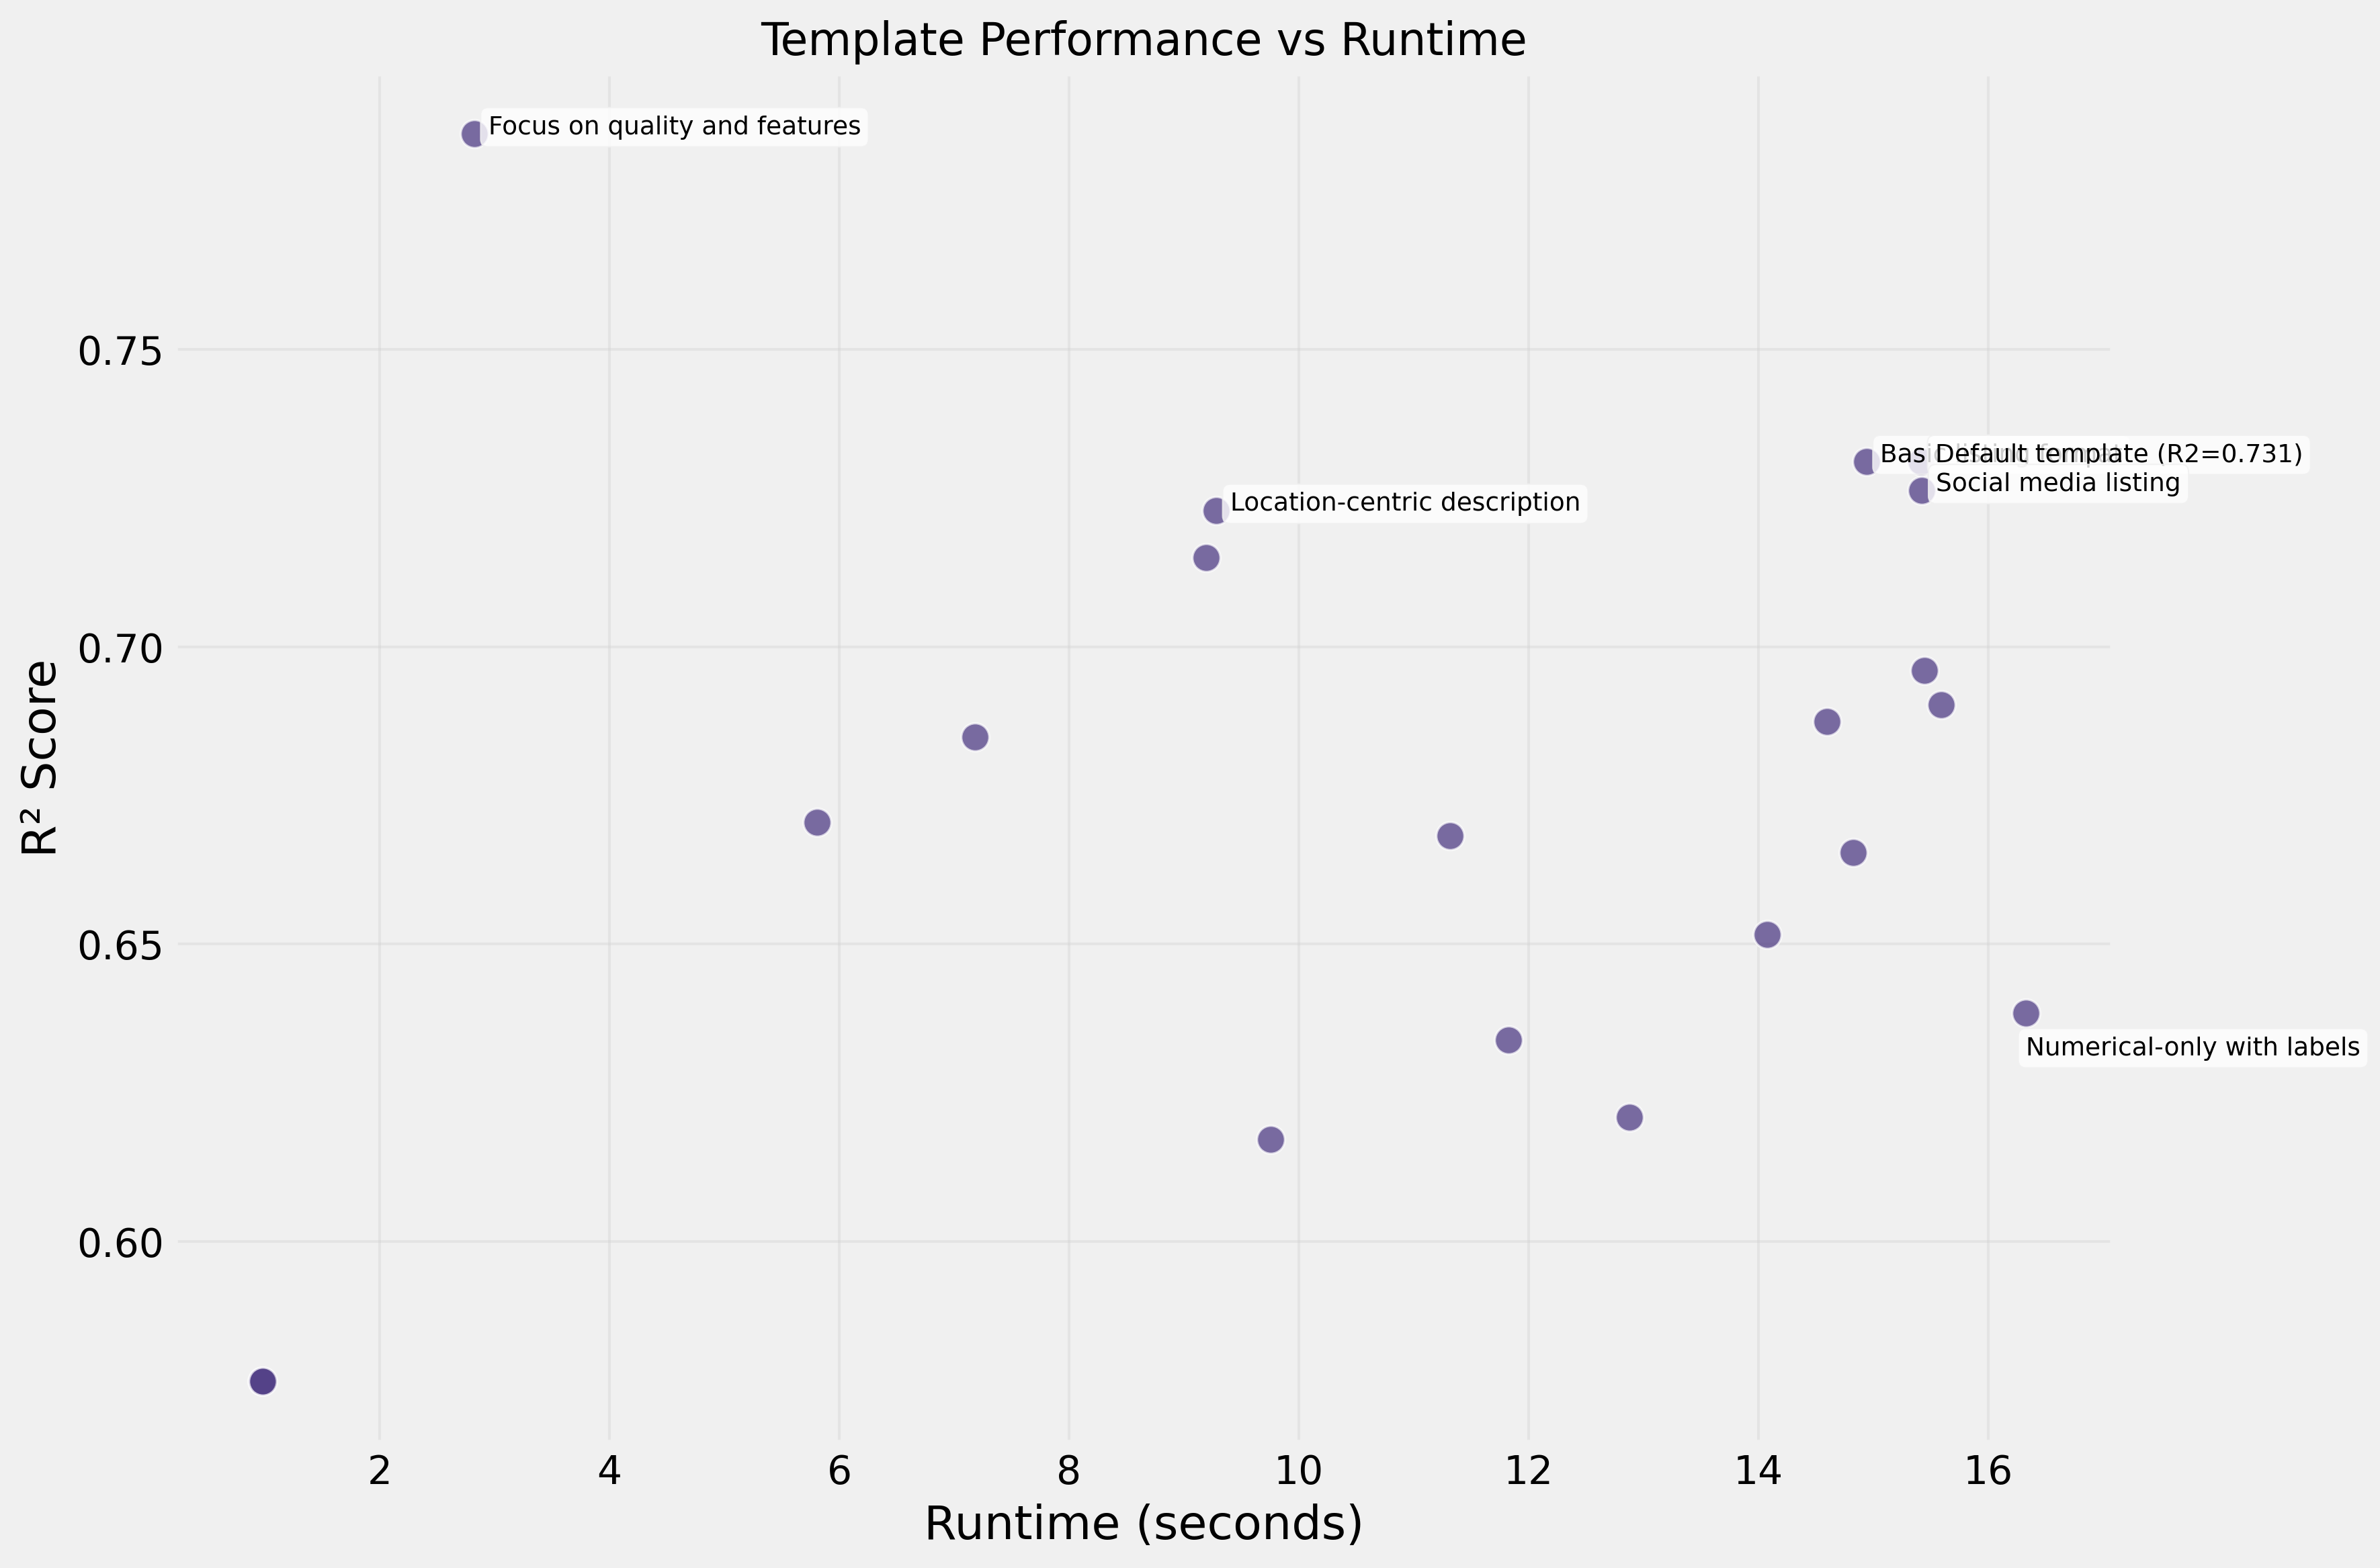
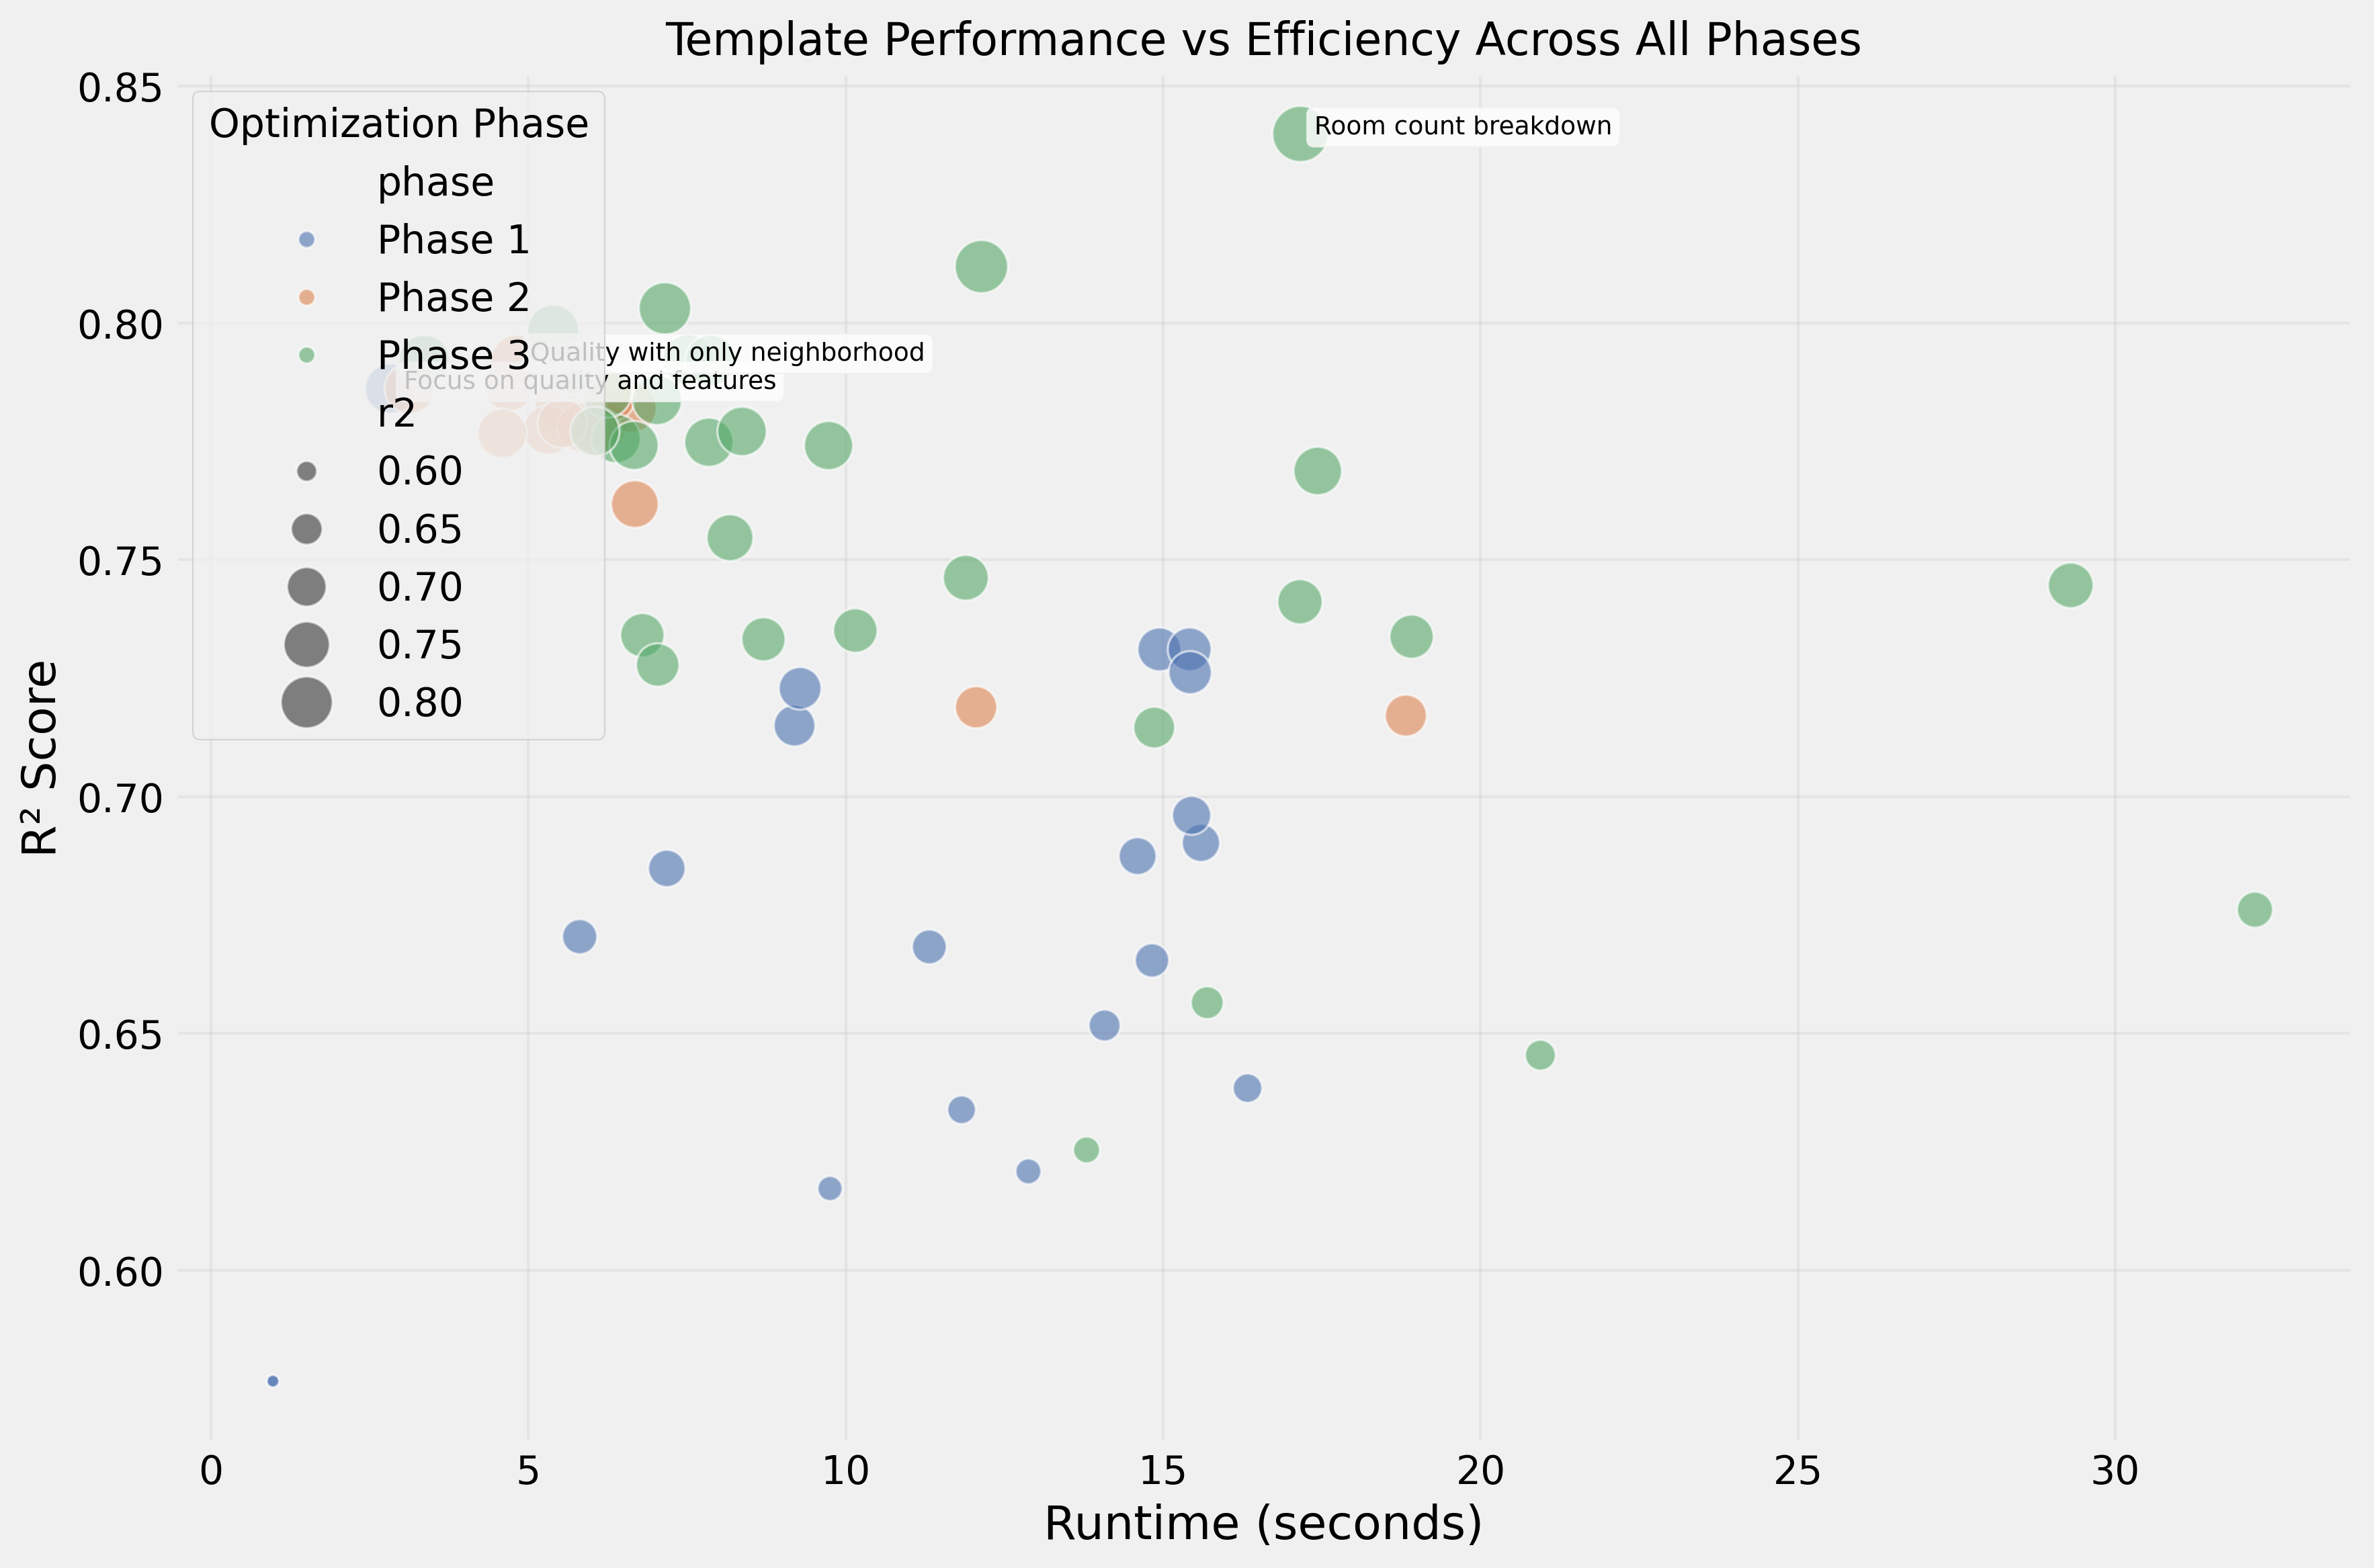
Efficiency
- Fastest templates (3–5s): quality + neighborhood focused → R² 0.792
- Slowest templates (15–32s): dense numerical data → R² 0.65–0.74
The fastest template processed 10× faster while achieving better performance.
Current Challenges
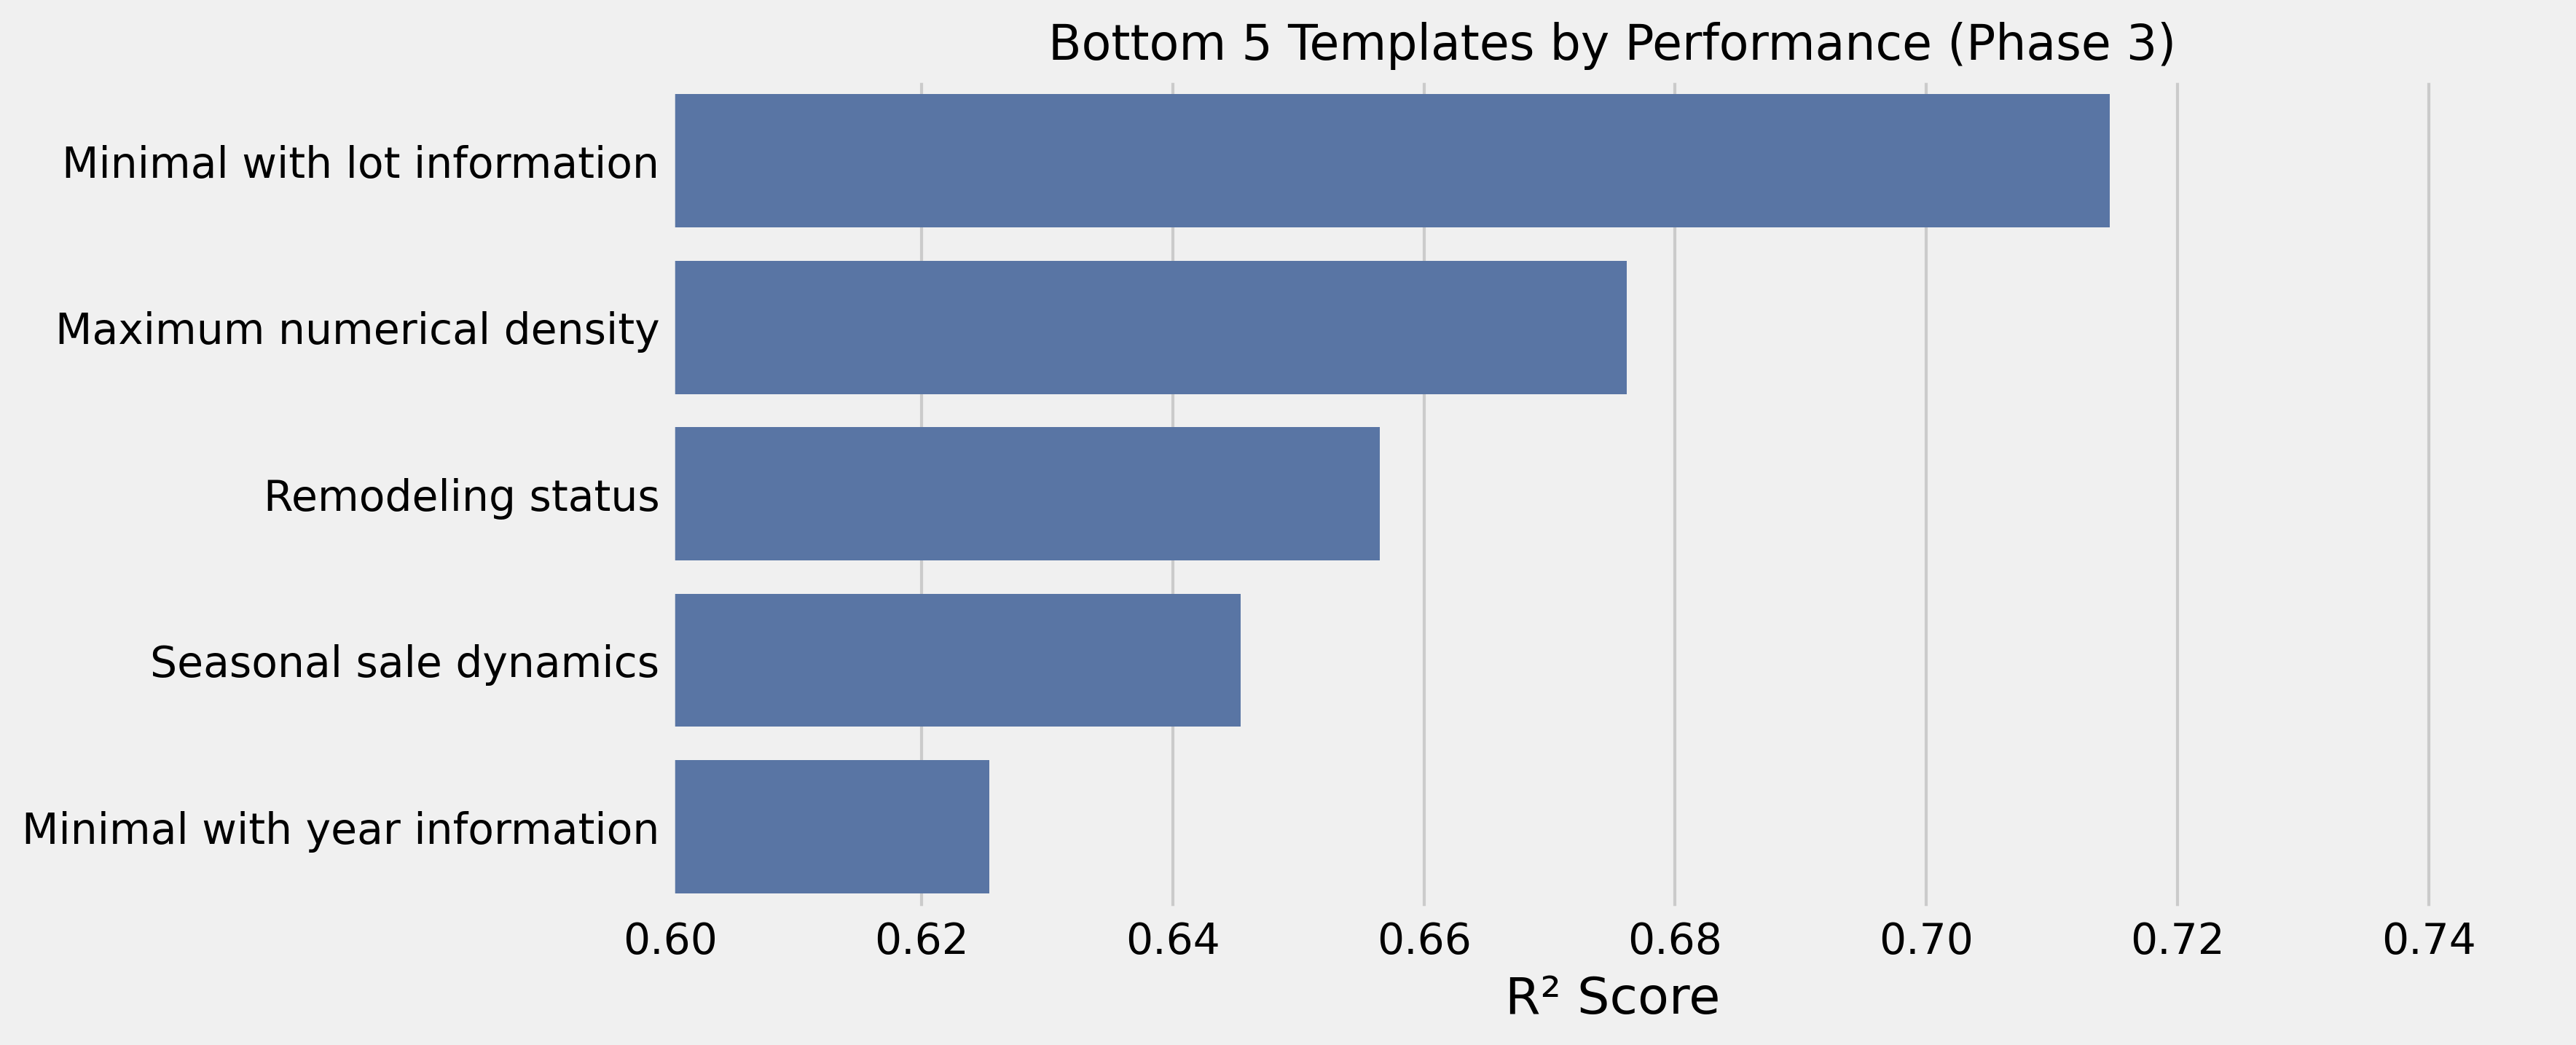
1. Temporal Features Struggle
Templates emphasizing dates and years performed poorly. Embedding models struggle with numerical temporal relationships — a year like “1985” doesn’t carry the same semantic meaning to an embedding model as it does to a real estate analyst.
2. Purely Categorical Templates Lack Context
Categorical variables without quality anchors performed among the worst (R² = 0.577). They need numerical indicators to provide meaningful context.
3. Purely Numerical Templates Lose Semantics
Templates focused solely on numbers also performed poorly (R² = 0.617–0.621). Embedding models don’t capture mathematical relationships without contextual framing.
4. Dense Numerical Templates Overwhelm Signal
Too many measurements at once creates a signal-to-noise problem (R² = 0.676).
5. Self-Referential Templates Cause Errors
Templates that referenced the target variable (sale_price) caused errors — a reminder to avoid target leakage in template design.
6. The Fundamental Gap
The gap between embedding-based (R² = 0.84) and traditional approaches (R² = 0.97) reflects fundamental limitations: embedding models are designed for natural language, not structured tabular data. They may miss precise mathematical relationships and treat numbers as categorical concepts.
The Path Forward
Looking ahead, I plan to apply these insights to the Universal Behavioral Modeling challenge, which seeks to develop user representations that generalize across multiple predictive tasks — churn prediction, product recommendations, and more. The embedding approach shows particular promise there, as it could capture the semantic meaning of user actions in a way that traditional feature engineering might miss.
Conclusion
While we haven’t yet matched the performance of traditional approaches (0.84 vs. 0.97 R² on Ames Housing), the gap is narrowing. The journey from tabular data to embeddings is just beginning, but the potential to transform feature engineering is enormous.
Stay tuned for more updates as this research continues to evolve.
This post was originally published on Medium.